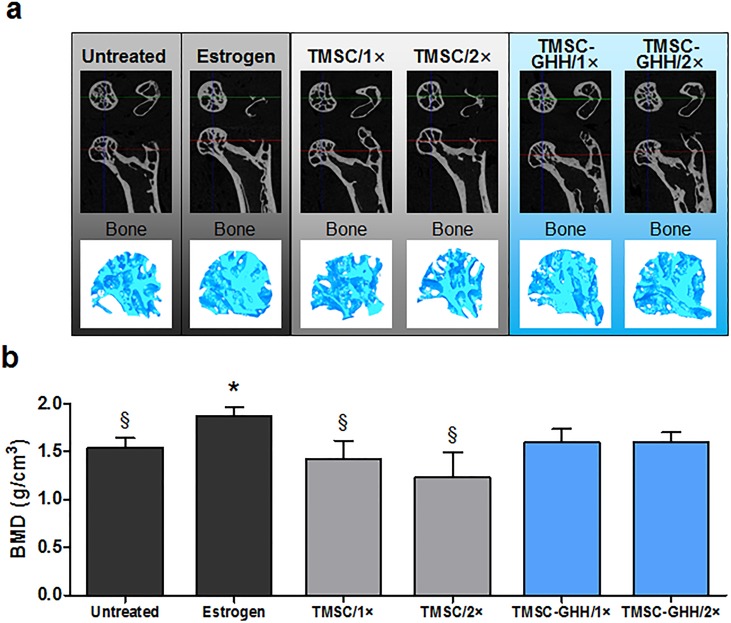
Fig 4. MicroCT images and BMD of femoral head trabeculae at the experimental endpoint.
(a) Representative horizontal and coronal cross-sectional images capturing the proximal end of a femur as well as a 3D-constructed image of the femoral head trabecular bone for each group. (b) BMD values calculated from the microCT images of femoral head trabeculae. Statistical significance is marked as *P < 0.05 against Untreated group, and §P < 0.05 against Estrogen group.

