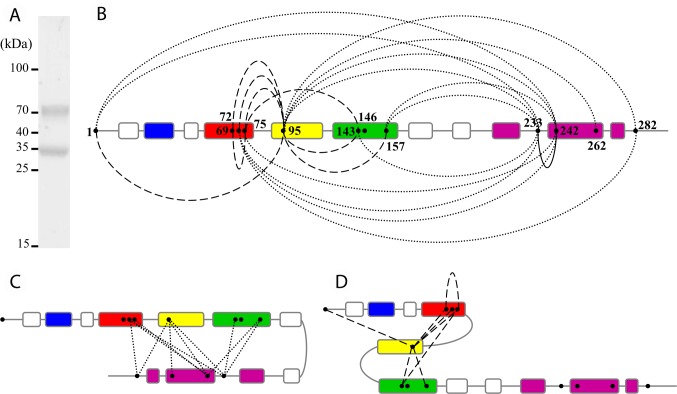
Fig 3. XL-MS of apoE4 nanodiscs.
(A) ApoE4 nanodiscs cross-linked by DSS and analyzed by SDS-PAGE (8%) stained with Coomassie blue. Cross-linking was carried out with a 8:1 molar ratio of DSS:apoE4 at 0.5 mg/ml apoE4 concentration. (B) Overview of the intramolecular XLs obtained for apoE4 nanodiscs after XL-MS analysis of the apoE4 monomeric band. Helices 1, 2, 3 and 4 from the NT domain are colored in blue, red, yellow and green respectively. The CT domain helices are colored in purple. Intra-NT domain XLs are shown by dashed lines, intra-CT domain XL by a straight line and NT to CT domain XLs by dotted lines. (C) Model of a hairpin conformation suggested by the extensive number and variety of NT to CT domain XLs. (D) Compact state of the NT domain suggested by the different intra-NT domain XLs.

