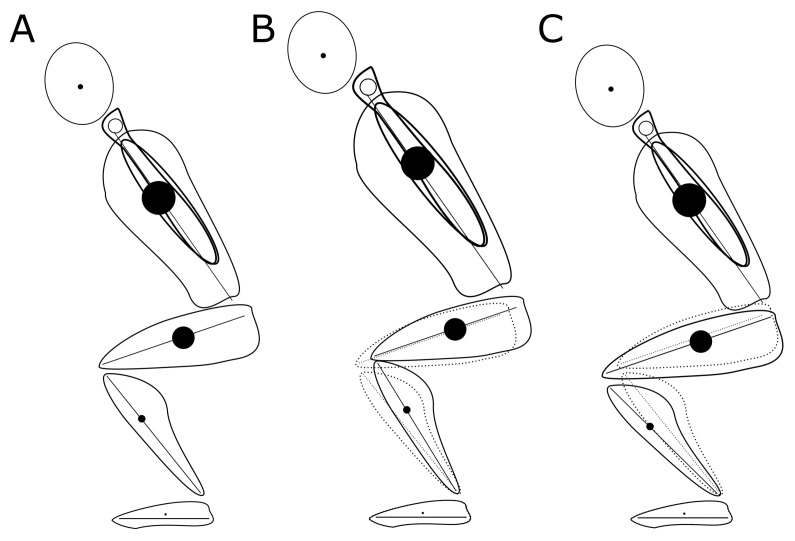
Figure 3.
Approximate representations of the squat position, with the thigh at a 70° angle from vertical. A. Mean segment lengths for the study population. B. Increase in the trunk/thigh length ratio (increased trunk length) leading to decreased ankle dorsiflexion and knee flexion (hip flexion and thigh angles unchanged). C. Increase in the thigh/shank ratio (increased thigh length) leading to increased ankle dorsiflexion and knee flexion (hip and thigh angles unchanged). The dotted lines in (B) and (C) represent the lower limb position in (A), while the solid circles represent the approximate positions and relative magnitudes of the centers of mass for each segment (foot, shank, thigh, trunk + arms, head).

