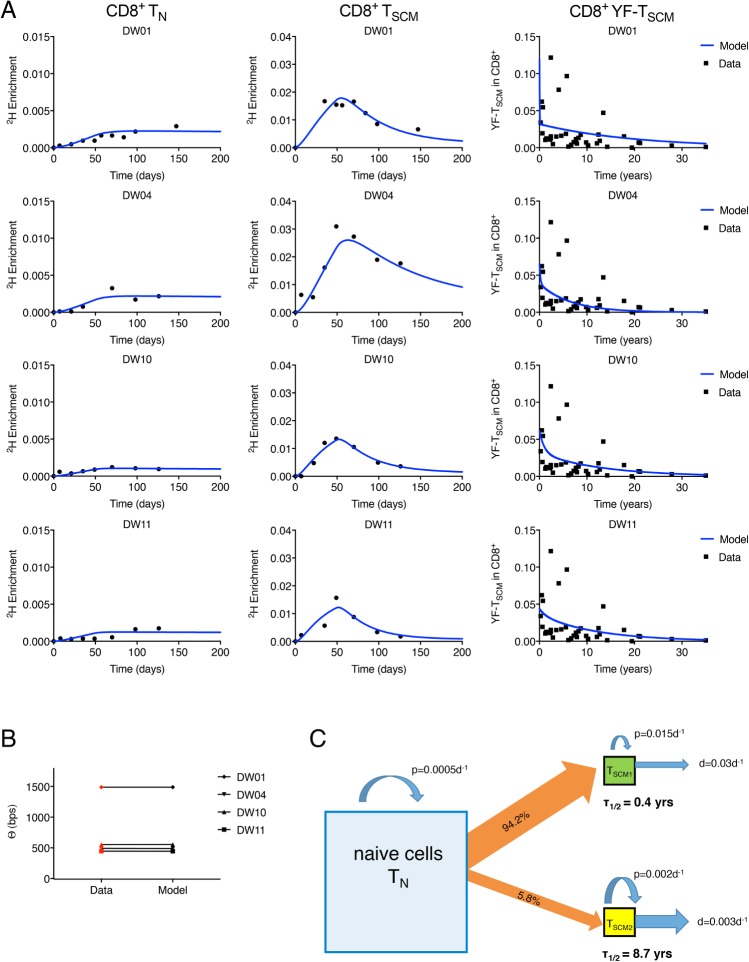
Fig 5. Label incorporation, telomere length, and YFV predictions for CD8+ TN and TSCM cells.
(A) Fit of the explicit heterogeneity model to isotope labelling data from CD8+ TN and TSCM cells and to the YFV-specific TSCM data. Experimental data are represented by solid black symbols. (B) fits to the average telomere length differences (Θ) between the CD8+ TN and TSCM pools, experimental data shown in red. The number of bps lost per division was taken to be δ = 50 bp/division. Isotope labelling, telomere length, and the YFV data were fitted simultaneously. (C) Schematic summary of estimated TN and TSCM dynamics. Estimates are the medians across subjects obtained from the fits shown in panels A and B. Parameter estimates for each subject are provided in Table 1 and S2 Table. The size of the squares is proportional to the population size. Labelling data and telomere data are provided in S1 Data; the YFV tetramer data were previously published [21]. bp, base pair; TN, naïve T; TSCM, stem cell–like memory T; YFV, yellow fever virus.

