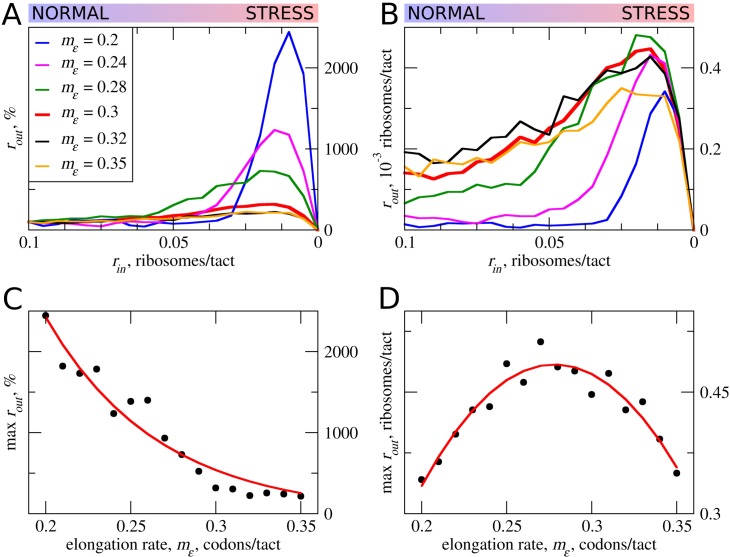
Figure 3. The effect the movement rates (mε) for elongating ribosomes on stress resistance.
Other parameters of the simulations tε>σ=0; tσ>ε=0.8; L=100; mσ=0.3. (A, B) Relative (rout[rin]/rout[rin=0.1]) (A) and absolute (B) changes in the density of ribosomes downstream of the uORF for a range of rin from 0.1 to 0 for different elongating ribosome movement rates (mε)). (C) Dependence of the relative (rout) maximum increase on elongating ribosome movement mε. (D) Dependence of the absolute maximum rout rate on the mε. Source data for panel (A )are provided in Figure 3—source data 1 and for panel (B) in Figure 3—source data 2.

