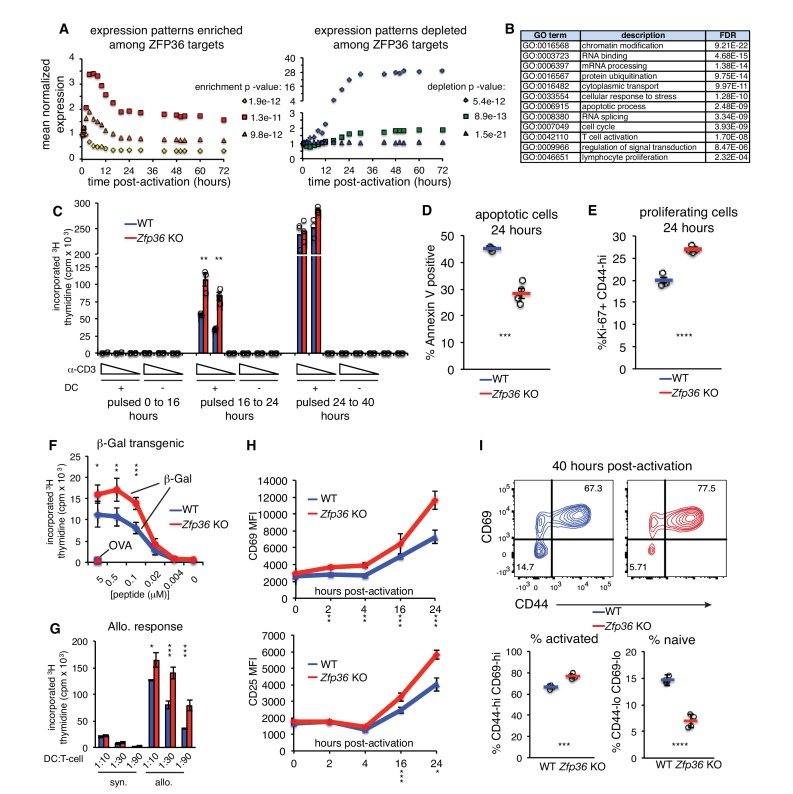
Figure 4. ZFP36 regulates T-cell activation kinetics.
(A) Gene expression patterns from a T-cell activation time course (Yosef et al., 2013) were partitioned by k-means, and enrichment of ZFP36 3’UTR and CDS targets was determined across clusters (Fisher’s Exact Test). Mean expression of genes in the three clusters most enriched (left) or depleted (right) for ZFP36 targets is plotted. (B) Enriched GO terms among ZFP36 HITS-CLIP targets (full results in Supplementary File 2). (C) Proliferation of naïve CD4 +Zfp36 KO and WT T cells in the indicated time windows after activation, measured by 3H-thymidine incorporation (D) Fractions of apoptotic annexin-V+ and (E) proliferating Ki67 +CD4+T cells 24 hr post-activation. Mean ± S.E.M. is shown; circles are individual mice (n = 3–4 per genotype). (F) Proliferation of BG2 TCR-transgenic CD4 +T cells cultured with DCs pulsed with cognate (β-gal) or irrelevant (OVA) peptide. Mean ± S.E.M. is shown (n = 5 mice per genotype). (G) Proliferation of CD4 +T cells co-cultured with syngeneic (C57BL6/J) or allogeneic (Balb-c) DCs. Mean ± S.E.M. of three replicate cultures is shown. (H) Levels of CD69 and CD25 after activation of Zfp36 KO and WT naïve CD4 +T cells. Mean ± S.E.M. is shown (n = 3–4 mice per genotype). (I) Naïve and effector subsets 40 hr post-activation in Zfp36 KO and WT CD4 +T cells. Representative plots are shown (top), along with mean ± S.E.M and circles for individual mice (n = 4 per genotype). For (C–I), results of two-tailed t-tests: *=p < 0.05; **=p < 0.01; ***=p < 0.001. Data are representative of three (H) or two (C–G, I) independent experiments.


