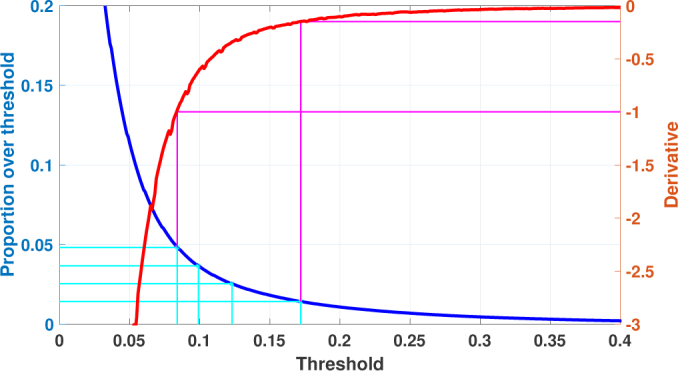
Fig. 3.

Selecting the values for the filtering threshold. The blue curve shows the proportion of the voxels passing the filtering as a function of the intensity values. The red curve is the estimated derivative of the blue curve. The magenta lines show how to determine the limit threshold values by the given derivative values of −1 and −0.15. The cyan lines show the uniformly distributed proportion values and define the filtering threshold intensities.
