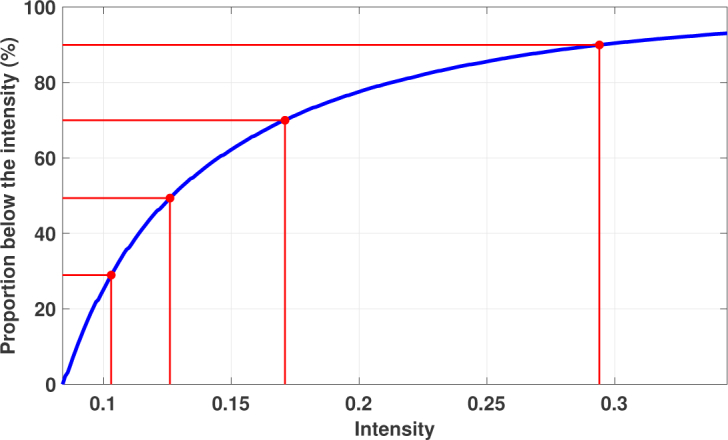
Fig. 5.

Selecting the values for the minimum intensity of the region growing starting points. The blue curve shows the proportion of the points below the given intensity value. The red dots on the curve correspond to the user given uniformly distributed proportion values, here [30 50 70 90]%, and define the minimum intensities.
