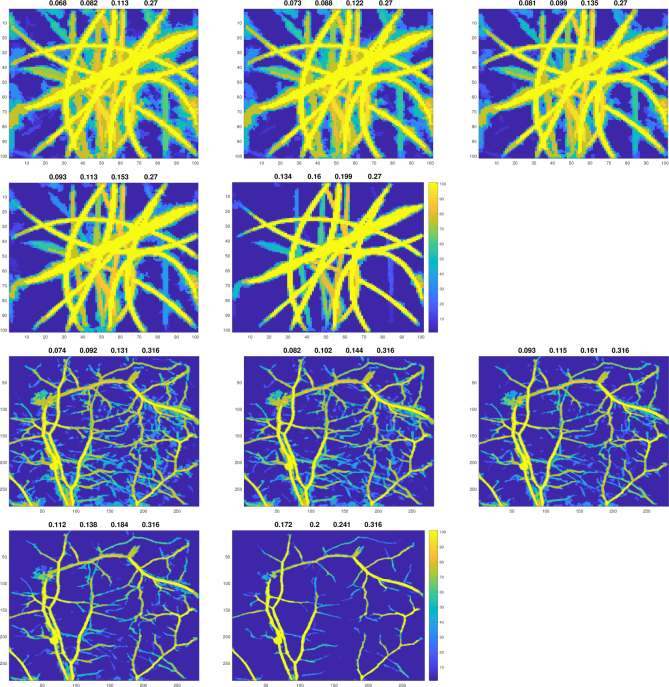
Fig. 11.
The real photoacoustic images shown in Fig. 7 segmented with reliability. The images on the two top rows show segmentations from the phantom experiment and the images on the two bottom rows show segmentations from the in vivo experiment. The values above the images are the applied filtering thresholds. The images are maximum reliability projections into z-direction.

