Fig. 3.
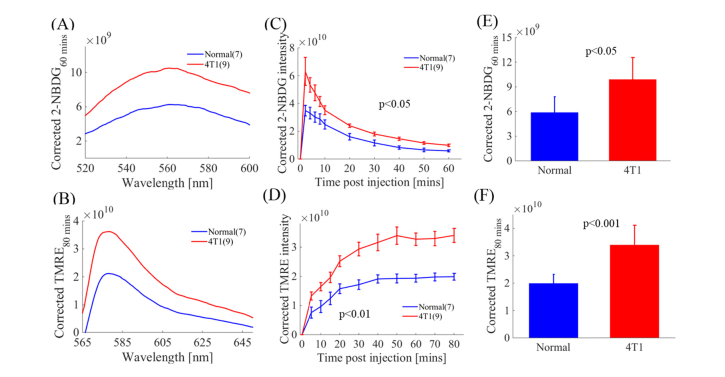
Optical quantification of intrinsic 2-NBDG fluorescence and TMRE fluorescence from tissue captures increased glucose uptake and increased mitochondrial metabolism in metastatic solid tumors compared with normal tissue. (A) MC model corrected 2-NBDG60 spectra from normal tissue and 4T1 tumors. (B) MC model corrected TMRE80 spectra from normal tissue and 4T1 tumors. (C) Representative 2-NBDG kinetic profiles obtained from MC corrected 2-NBDG fluorescence for normal tissue and 4T1 tumors. (D) Representative TMRE kinetic profiles obtained from MC corrected TMRE fluorescence for normal tissue and 4T1 tumors. (E) MC corrected 2-NBDG60 uptake is significantly higher in 4T1 tumors compared with normal tissue (p<0.05). (F) Corrected TMRE80 is significantly higher in 4T1 tumors compared with normal tissue (p<0.001). NS = not significant. N = 7-9 mice/group. Error bars in the graph represent standard errors. Comparison of the mean intensity of 2-NBDG60 and TMRE80 across animal groups was performed with two sample t-tests using the MATLAB (Mathworks, USA) statistics toolbox. Comparison of mean kinetic curves across animal groups was performed with a two-way Analysis of Variance (ANOVA) test using the MATLAB (Mathworks, USA) statistics toolbox.

