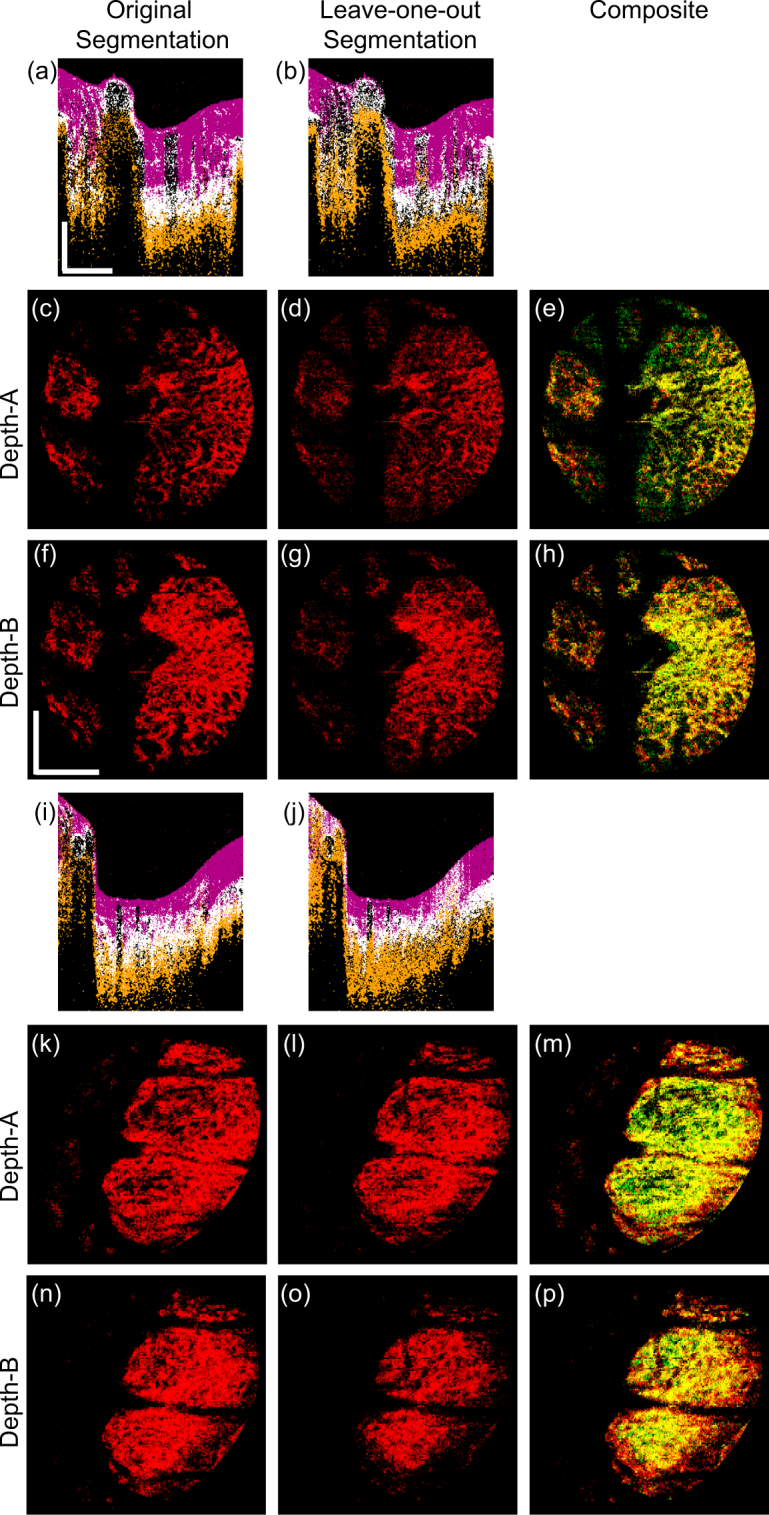
Fig. 7.

A comparison of the original and leave-one-out segmentations. The upper half of the figure shows the images of the left eye of Subject-3 (emmetropia); and the lower half shows the left eye of Subject-1 (myopia). The first and second columns show the original and leave-one-out segmentations. The third column shows the red-green composite of the first and second column images, where the original and leave-one-out segmentation results are in red and green, respectively. The first and fourth rows show the cross-sectional meta-label images, the second and fifth rows show the en face lamina beam at Depth-A, and the third and sixth rows show that at Depth-B. Scale bars indicate 0.5 mm × 0.5 mm.
