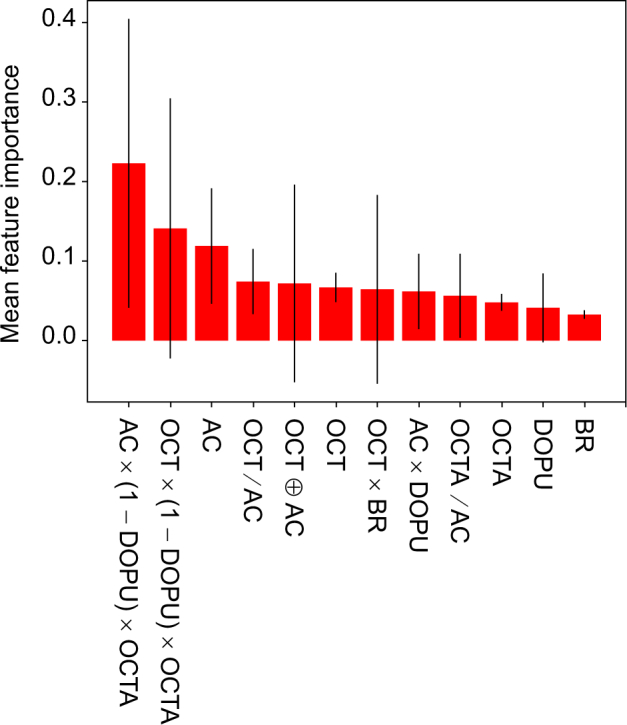
Fig. 12.

The mean and standard deviations of the Gini importance for each feature. The mean was computed over 10 decision trees in the trained random forest classifier. The heights of the red bars indicate the mean importance of each feature; and the black lines indicate the standard deviation.
