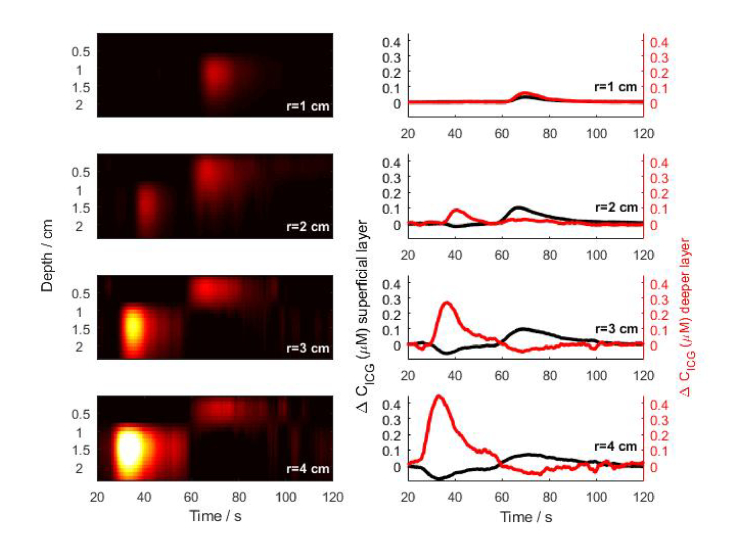
Fig. 6.
Phantom with long loop studies. Left panel: changes (colorbar) of the ICG concentration in all (24) layers of the model versus time before and after injection of an ICG bolus at T0 = 24 s. The ΔCICG,j values were calculated from moments of DTOFs measured at multiple wavelengths and single source-detector separation (r = 1, 2, 3 and 4 cm). The colormaps were scaled in that way that all negative values were ignored for clarity. Right panel: the dynamics of ICG concentration changes in the deeper (first peak, red) and superficial (second peak, black) segments of the tube, obtained by averaging the ΔCICG changes in the layers of each segment (superficial and deeper).

