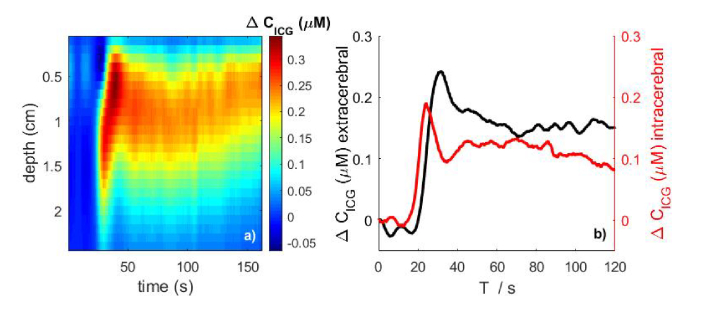
Fig. 10.
a) Changes (colorbar) of the ICG concentration ΔCICG,j in 24 layers of the head model (each 0.1 mm thick) versus time before and after injection of an ICG bolus at T0 = 0 second. These changes were calculated from moments of DTOFs measured at multiple wavelengths and single source-detector separation (r = 3 cm). b) Changes in the ICG concentration averaged over the top 12 layers (extracerebral tissue compartment of the thickness of 1.2 cm) and the remaining 12 bottom layers (intracerebral tissue compartment).

