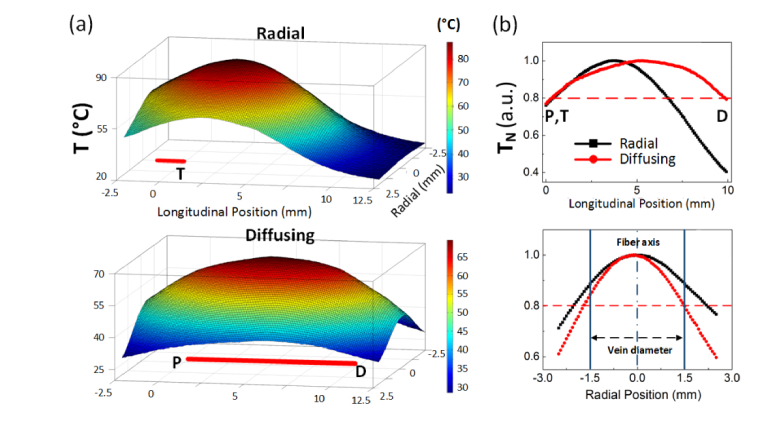
Fig. 3.
Thermal profiles obtained from IR images in leporine veins (P = 5 W, no pull-back, and 7-s after irradiation): (a) 3D temperature profile (top: radial and bottom: diffusing; T: tip of radial fiber; P: proximal and D: distal tips of diffusing fiber) and (b) normalized temperature (TN) along longitudinal (top) and radial directions (bottom).

