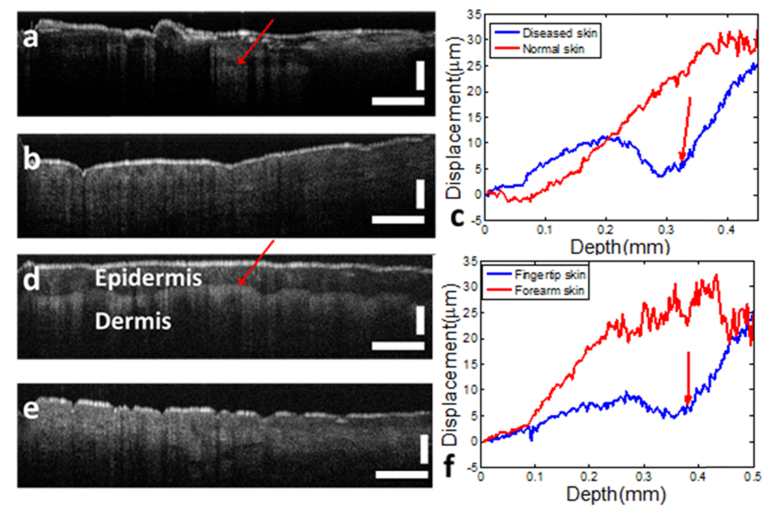
Fig. 12.
(a) in vivo OCT image of diseased skin at the back of the hand; (b) in vivo OCT image of normal skin at the back of the hand; (c) displacement measured through adaptive Doppler analysis of OCT signal for diseased skin and normal skin; (d) in vivo OCT image of fingertip skin; (e) in vivo OCT image of forearm skin; (f) displacement measured through adaptive Doppler analysis of OCT signal for fingertip skin and forearm skin. Scale bars represent 500μm.

