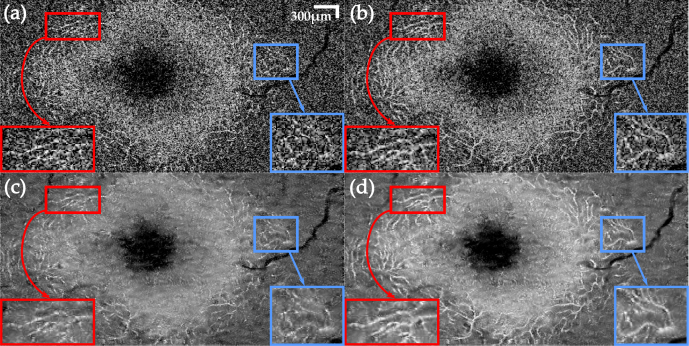
Fig. 5.
En-face view comparison of a single layer in the outer plexiform layer with single and multilook tomograms: singlelook (a) and multilook (b) tomograms with speckle, and corresponding singlelook (c) and multilook (d) after using TNode 3D. Boxes highlight structures corrupted by speckle that appear clearer after TNode. See Visualization 2 (48MB, avi) for a comparison of the tomogram.

