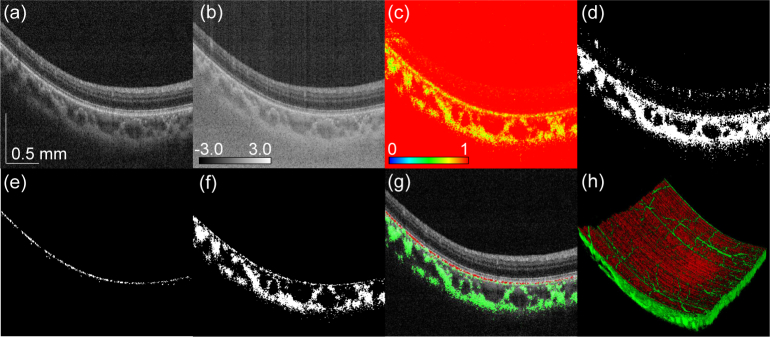
Fig. 1.
Multi-contrast images and segmentation results for a normal case. (a) Scattering intensity, (b) AC presented in the decadic logarithm of the attenuation coefficient in mm−1 unit, (c) DOPU, (d) binarized OCTA, (e) segmented RPE, (f) segmented choroidal stroma, (g) RPE (red) and choroidal stroma (green) overlaid on scattering intensity, and (h) volume rendering of RPE (red) and choroidal stroma (green). The scale bar indicates 0.5 mm × 0.5 mm.

