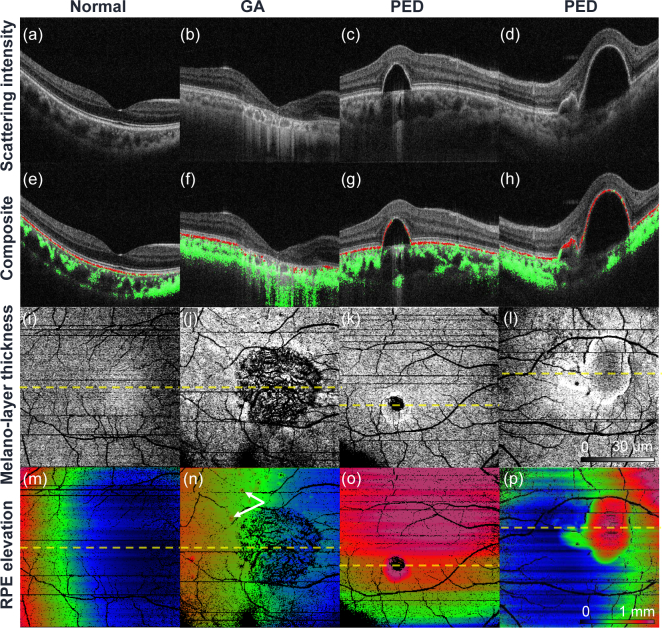
Fig. 4.
Examples of en face RPE analysis. The first row shows representative OCT cross-sections. The second row shows the same OCT cross-section, but with the segmented RPE and choroidal stroma overlaid as red and green pixels, respectively. The third and fourth rows are melano-layer thickness maps and RPE elevation maps, respectively. The first to fourth columns represent normal and GA cases, and two PED cases. The positions of the OCT cross-sections (first and second rows) are indicated by horizontal dashed lines on the en face images (third and fourth rows).

