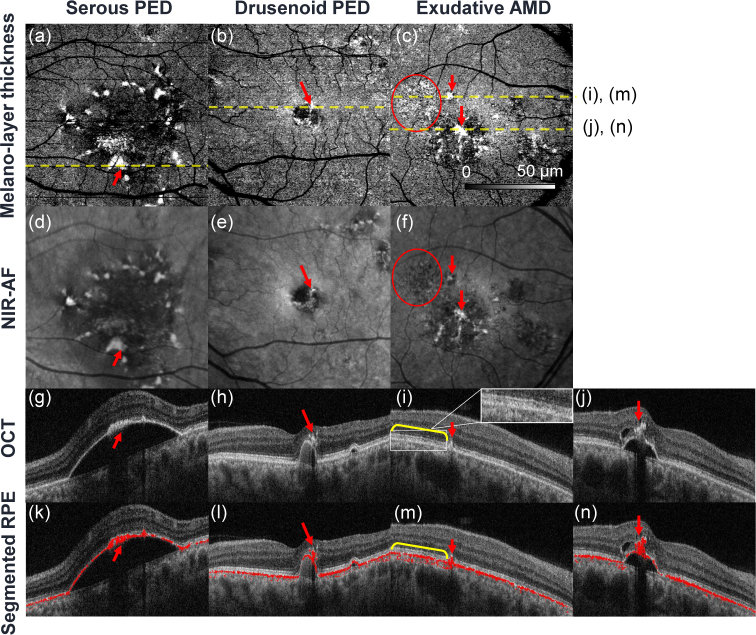
Fig. 5.
Comparisons between melano-layer thickness maps [(a)-(c)] and NIR-AF images [(d)–(f)]. The third row [(g)–(j)] shows representative OCT cross-sections, and the fourth row [(k)-(n)] shows the same OCT images but with the segmented RPE overlaid as red pixels. The position of each cross-sectional image is indicated on the corresponding sub-figure (a)–(c). The columns represent serous PED, drusenoid PED, and exudative AMD cases from left to right.

