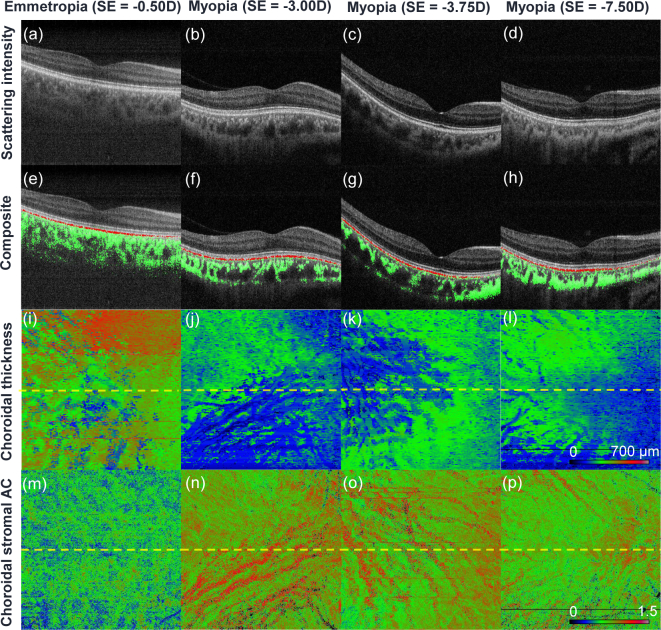
Fig. 6.
Examples of en face maps representing choroidal characteristics. The first row shows representative OCT cross-sections. The second row shows the same OCT cross-sections, but with the segmented RPE and choroidal stroma overlaid as red and green pixels, respectively. The third and fourth rows show choroidal thickness maps and choroidal stromal AC maps, respectively. The first to fourth columns represent normal to myopic cases with the spherical equivalent refractive errors of -0.50, -3.00, -3.75, -7.50 D, respectively. The position of the OCT cross-sections (first and second rows) are indicated by horizontal dashed lines on the en face images (third and fourth rows).

