
Fig. 7.
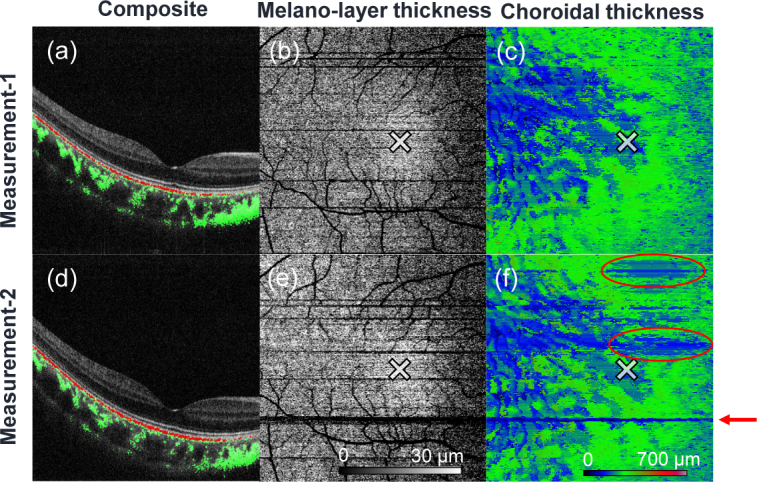
Comparison of pairs of measurements of the same subject. The two rows represent the two different measurements. The first column shows OCT cross-sections overlaid with the segmented RPE (red) and the choroidal stroma (green). The second and third columns show the melano-layer thickness maps and the choroidal thickness maps, respectively. The ‘×’ symbols indicate the foveal positions, while the red circles and the arrow shown in (f) indicate the discrepancies between the two measurements.