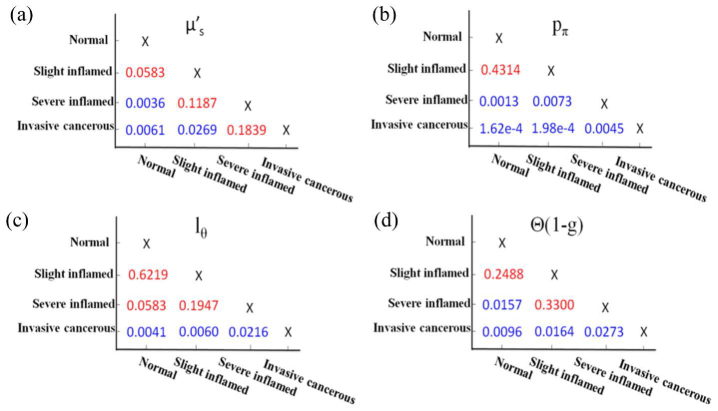
Fig. 10.
The two-sample t-test p-values for each pairwise combination of tissue diagnoses with each scatter parameter (a) , (b) pπ,(c) lΘ and (d) Θ(1-g). The blue color indicates a significant p-value at the p < 0.05 level. A smaller p-value suggests a more significant discrimination power between two different disease states of tissues.

