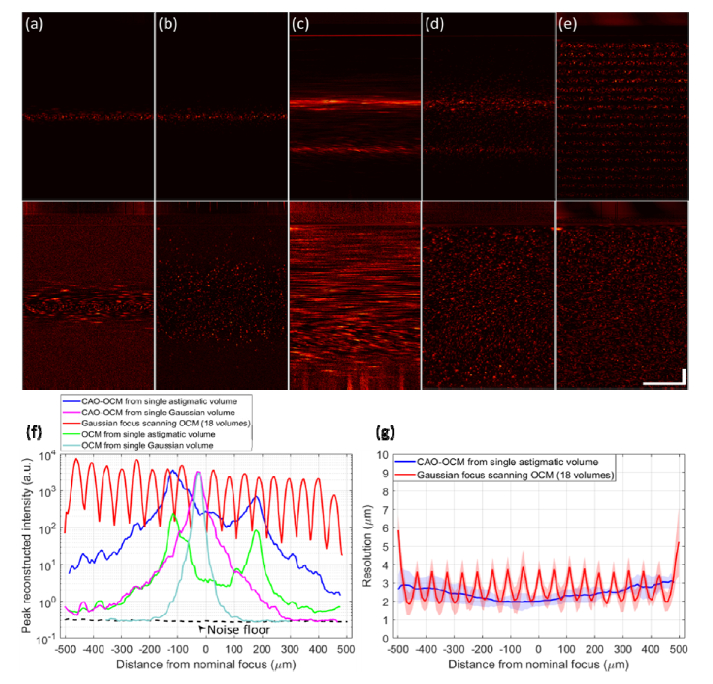
Fig. 3.
Performance characterization of Gaussian versus astigmatic illumination beams in a resolution phantom, using ESI. (a-e) Comparison of cross-sectional energy distribution across depth, from maximum intensity projection of a 250μm slice. The bottom row is the depth-normalized version of the top row (method explained in Sect. 4.2), with (a) OCM with Gaussian beam, (b) CAO-OCM with Gaussian beam, (c) OCM with astigmatic beam, (d) CAO-OCM with astigmatic beam, and (e) focus scanning OCM fused from 18 volumes. Scale bars indicate 100 μm for all images. (f) Quantitative measurement of peak reconstructed OCT signal intensity. (g) FWHM resolution for hyAO and focus scanning OCM. Color-filled regions indicate ± one standard deviation. In (f) and (g), the depth axis matches the portion of the cross sectional images that are below the sample surface.

