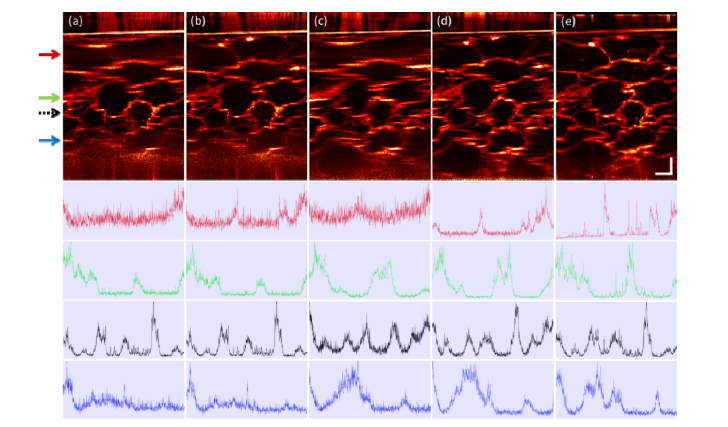
Fig. 4.
Comparison of cross sectional energy distribution across depth in grape imaging, from maximum intensity projection of a 10 μm slice, in EPI. (a) OCM with Gaussian beam, (b) CAO-OCM with Gaussian beam, (c) OCM with astigmatic beam, (d) CAO-OCM with astigmatic beam, (e) Focus scanning OCM fused from 18 volumes. The line plots indicate the normalized intensity profile in the image at four depths, labelled by arrows with corresponding color, with black dashed arrow representing the focal plane position for the standard Gaussian acquisition. All images are depth-normalized with the same method as in the phantom results in Fig. 3. Scale bars indicate 100 μm for all images. A gamma correction with γ = 0.7 was applied to all images.

