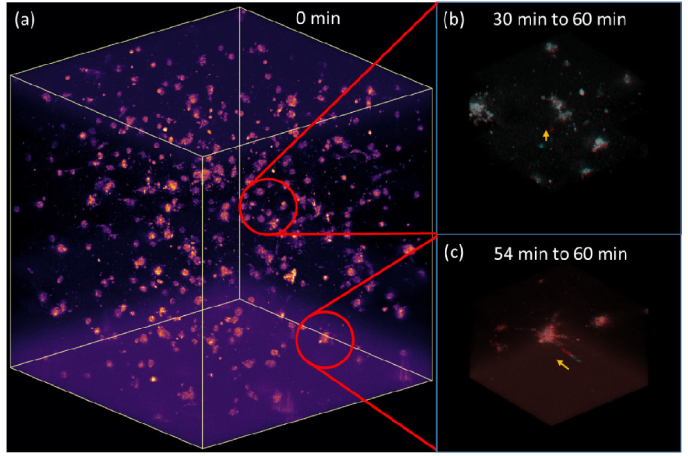
Fig. 5.
Volumetric visualization of fibroblast cell dynamics. (a) the entire volume with 1 mm × 1mm × 1mm FOV, extracted from Supplementary Visualization 1 (17.9MB, mp4) . (b) cell exhibits upward motion in a 30 min duration, (c) cell exhibits rapid sideways motion in a 6 min duration. Both (b) and (c) cover a 0.25mm × 0.25mm × 0.25mm volume, with the initial time point indicated by the cyan channel and final time point by the red channel.

