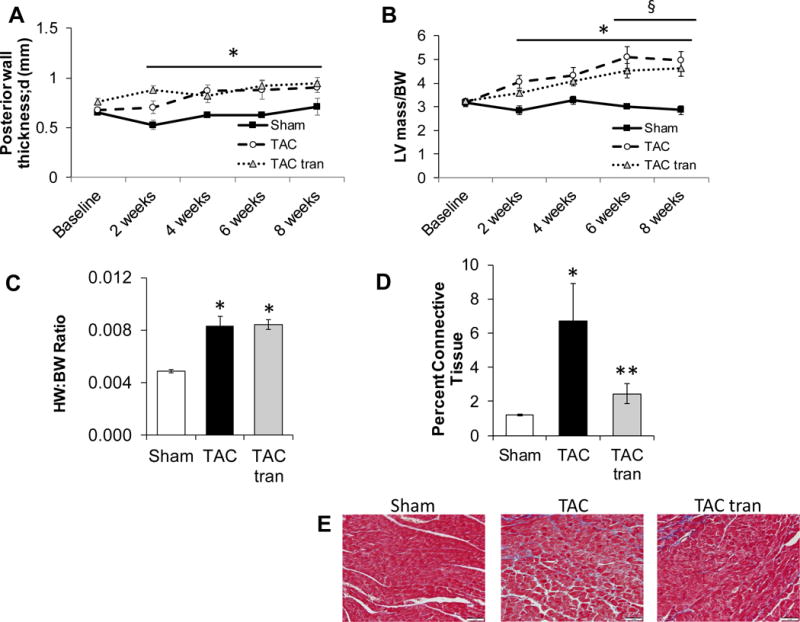
Figure 4. Hypertrophic and fibrotic response to 8 weeks treatment with tranilast.

Sham, TAC, and TAC tranilast posterior wall thickness (A) and LV mass/BW (B) was determined using echocardiography (*P<0.05 TAC compared to sham; §P<0.05 TAC tranilast compared to sham). HW/BW ratio (C) 8 weeks post-surgery (*P<0.05 compared to sham). Masson’s trichrome stained slides were used to determine the percentage of connective tissue (D, representative images E; *P<0.05 TAC compared to sham; **P<0.05 TAC versus TAC tranilast). P values are from two-way ANOVA RM (A and B) and one-way ANOVA (C and D).
