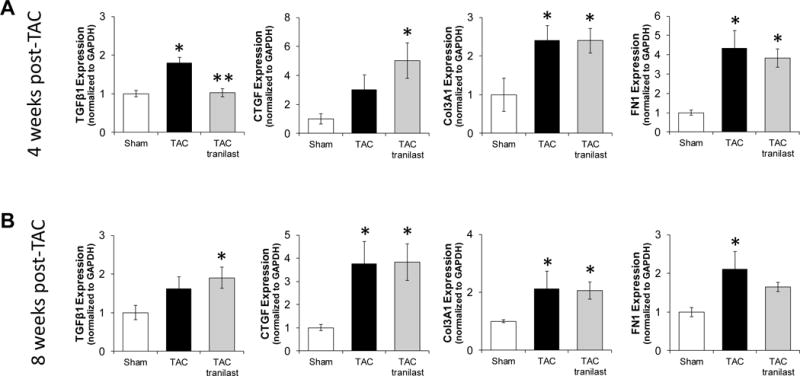
Figure 5.

Expression of fibrotic markers in sham, TAC, and TAC tranilast whole mouse hearts. mRNA expression levels were determined for TGF-β1, CTGF, Col3A1, and FN1 at 4 (A) and 8 (B) weeks post-TAC (*P<0.05 compared to sham; **P<0.05 TAC vs TAC tranilast). P values are from one-way ANOVA.
