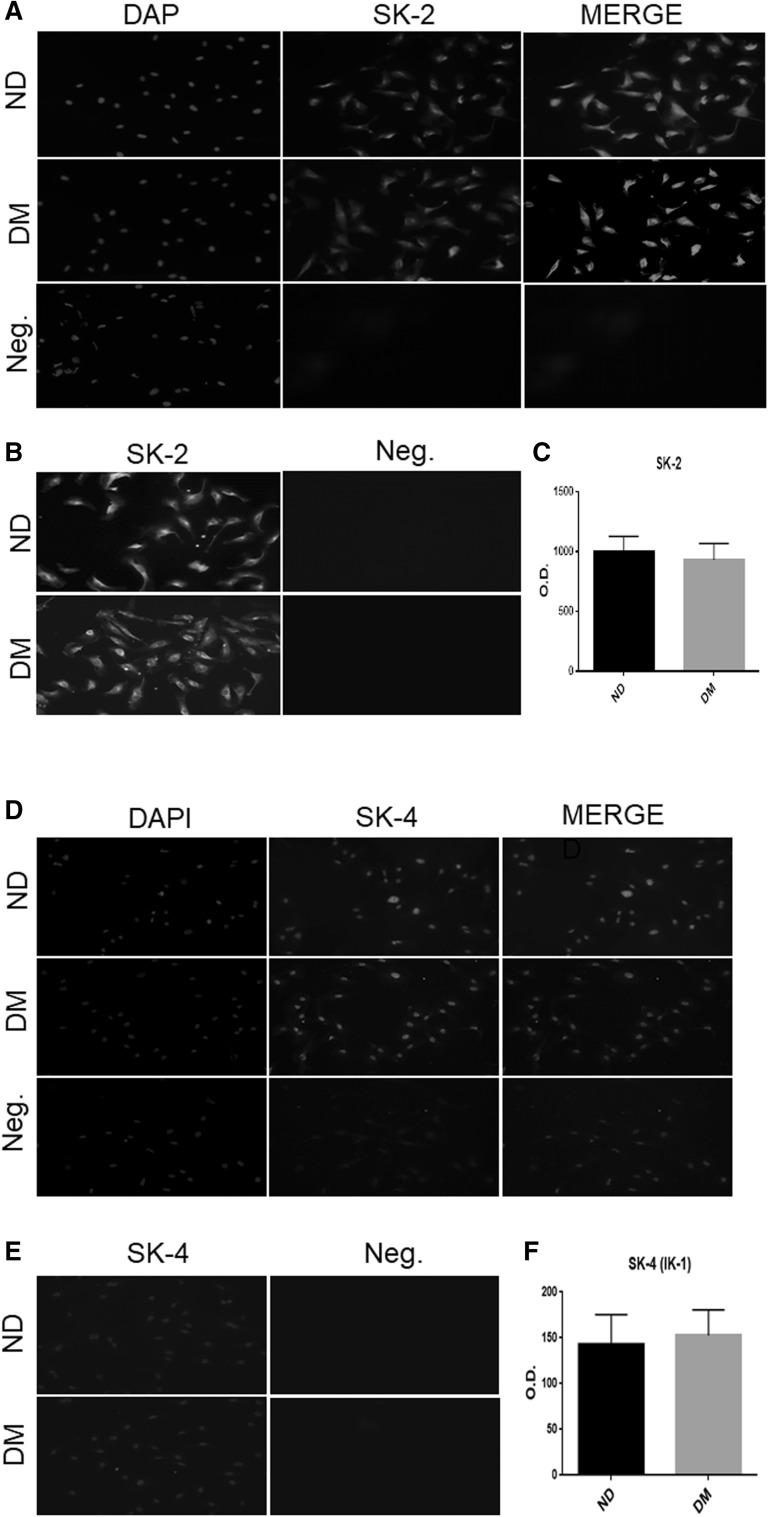
Fig. 4.
a, d Immunofluorescence staining of SK-2 and SK-4 (IK-1) in the cultured human coronary arterial endothelial cells (HCAECs) from ND and DM patients; Cells were co-stained for cell nuclei (blue), and SK-2 (red, a) or SK-4 (IK-1) (green, d); b, e Intensity of SK-2 (b) and SK-4 (IK-1, e); c, f Densitometric analysis of signal intensities shows no differences in SK-2 (c) and SK-4 (IK-1, f) distribution in HCAECs between ND and DM group Mean ± SD, n = 5/group. (Color figure online)

