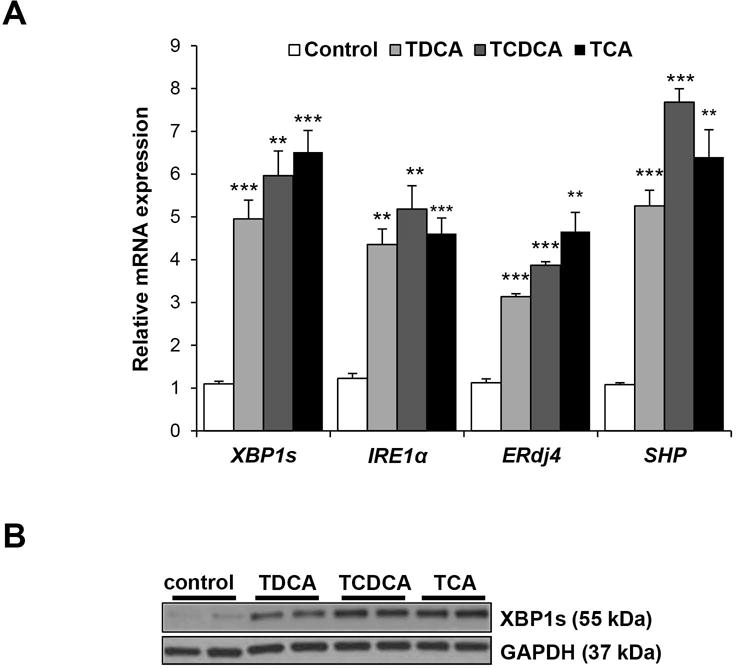
Figure 3. XBP1s protein and gene expression of Huh7-Ntcp cells treated with bile acids.

Huh7-Ntcp cells were treated with TCA (10 μM), TDCA (10 μM) and TCDCA (10 μM) for 6 hours. A) XBP1s, ERdj4, IRE1α and SHP gene expression was measured using qPCR. B) XBP1s protein expression was examined in cell homogenate using western blotting with GAPDH used as a loading control. **P < 0.01, ***P < 0.001 compared to control.
