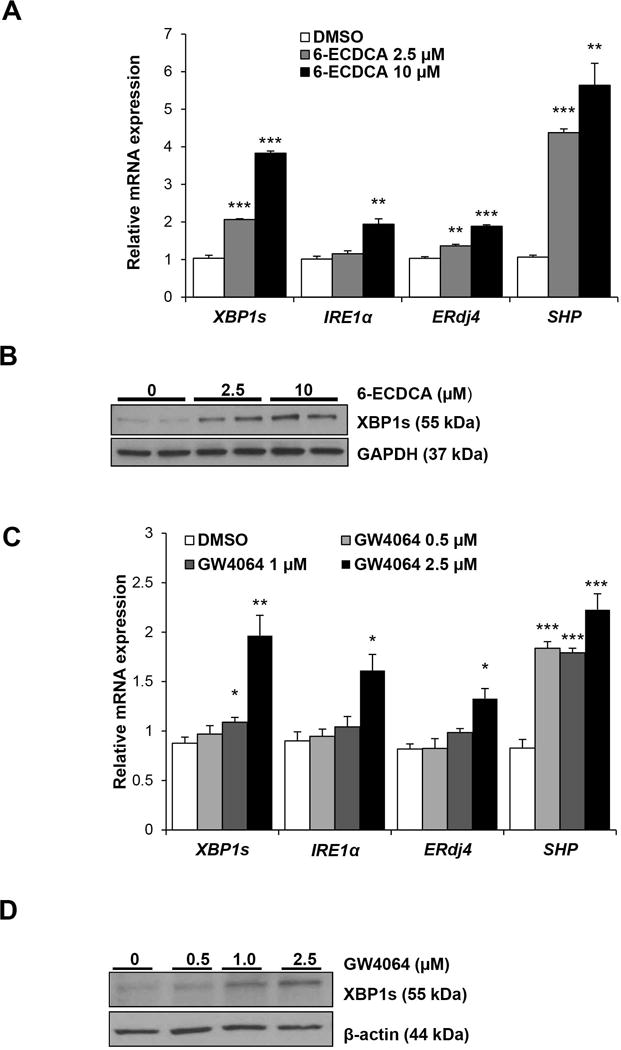
Figure 4. XBP1s protein and gene expression of Huh7-Ntcp and HepG2 cells treated with FXR agonists.

A) Huh7-Ntcp cells were treated with 6-ECDCA (0-10 μM) or DMSO vehicle for 4 hours and IRE1α, XBP1s, ERdj4 and SHP gene expression was measured with qPCR. B) Representative western blot of XBP1s is shown with GAPDH used as a loading control. C) HepG2 cells were treated with GW4064 (0-2.5 μM) or DMSO vehicle for 6 hours and IRE1α, XBP1s, ERdj4 and SHP gene expression was measured. D) Representative western blot of XBP1s is shown with β-actin used as a loading control. *P< 0.05, **P < 0.01, ***P < 0.001 compared to DMSO.
