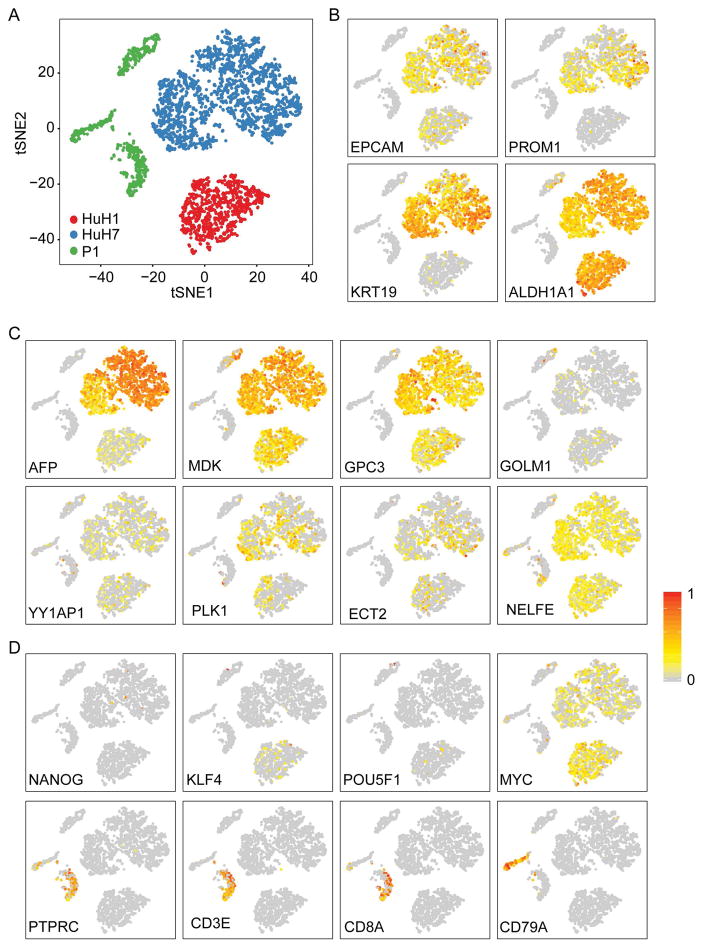
Figure 5. Transcriptomic patterns of HuH1, HuH7 and P1 based on 10X genomics single cell analysis.
(A) 2D visualization of (10X Genomics) data from 899 HuH1 cells, 2088 HuH7 cells and 860 freshly isolated primary HCC cells by t-SNE. (B) t-SNE plots showing expression and distribution of hepatic CSC related genes. (C) HCC associated genes. (D) stemness-associated genes or immune cell genes. For panels B–D, each cell was colored based on their normalized expression of indicated genes, i.e., a gradient of gray, yellow, and red indicating low to high expression.

