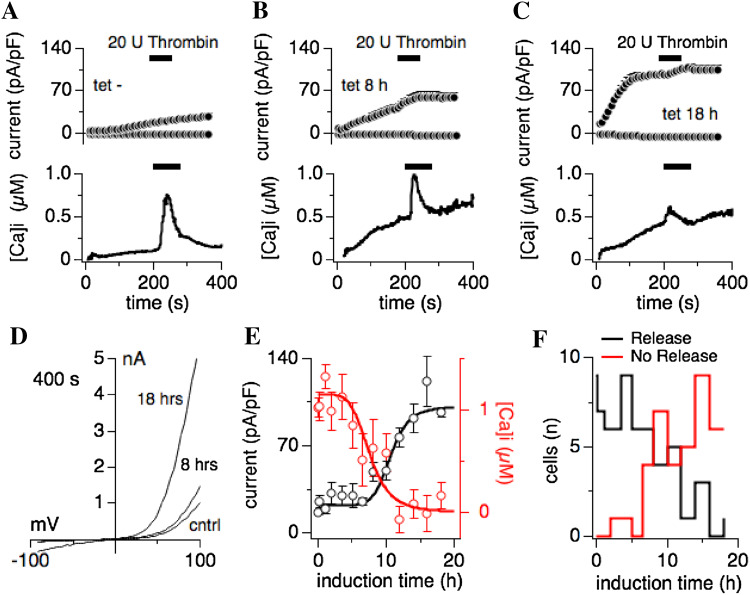
Fig. 1.
Heterologous overexpression of human TRPM7 inhibits thrombin-induced Ca2+ release. HEK293-TREx cells stably transfected with tetracycline-inducible human TRPM7 (hTRPM7; [5]) were subjected to combined voltage-clamp and Fura-2 measurements to assess whole-cell currents and intracellular Ca2+ changes. Voltage ramps were given from − 100 to + 100 mV over 50 ms. Current amplitudes were extracted at − 80 and + 80 mV, normalized to cell size in pF, averaged and plotted versus time of the experiment. As indicated by the black bars, 20 U thrombin, added to an external standard solution in 0 mM Ca2+, was applied to individual cells to evoke receptor-stimulated Ca2+ release. Ca2+ traces were averaged and plotted over time of the experiment. Internal solution was supplemented with 0.3 mM Na·GTP and 200 µM Fura-2, in the absence of any ATP supplementation. Error bars are SEM. a The graph depicts current development of endogenous TRPM7 in non-induced hTRPM7-HEK293-TREx cells (upper panel) and intracellular Ca2+ changes (lower panel) (n = 10). b Shown is the overexpressed hTRPM7 current development in hTRPM7-HEK293-TREx cells induced for 8 h with tetracycline (upper panel) and intracellular Ca2+ changes (lower panel) (n = 11). c Same experimental setup as in a and b, but here cells were tetracycline-induced for 18 h (n = 7). d Current–voltage traces of TRPM7 currents extracted from representative cells that were either non-induced (cntrl), tetracycline-induced for 8 and 18 h, and at 400 s into the experiment. e Dose–response curve of hTRPM7 expression and thrombin-induced Ca2+-release in dependence of induction time. Averaged peak currents (black circles) assessed at 400 s into the experiment are plotted against tetracycline induction time (n = 4–12). Red circles represent the maximal change in Ca2+ signal induced by extracellular thrombin application, and measured in the same cells (n = 4–12). f TRPM7 overexpression reduces the likelihood of thrombin-induced Ca2+ release. The graph plots the number of cells that either release (in black) or do not release (in red) Ca2+ in response to extracellular thrombin

