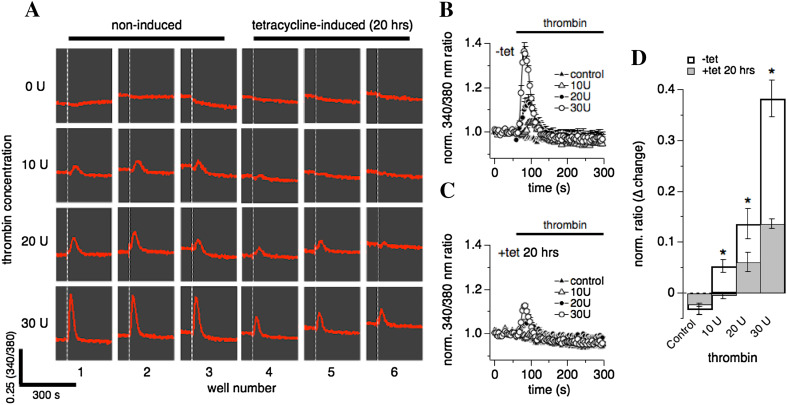
Fig. 2.
Thrombin-induced Ca2+ release is dose-dependent. hTRPM7-HEK293-TREx cells were investigated for thrombin-induced Ca2+ release using a fluorescent kinetic plate reader in a 96-well format (see “Materials and methods”). Data capture proceeded at 1 Hz over 300 s. a Ratiometric raw data traces of Fura-2 emission signals (in red) measured in 24 individual wells on a 96-well plate over 300 s. Excitation wavelengths were 340 and 380 nm. The white dashed vertical bar in each well indicates time of application of either control (0 U), 10 U, 20 U or 30 U of thrombin, repeated in three wells each (1–3 for non-induced cells, 4–6 in tetracycline-induced cells for 20 h). b The 340/380 nm ratio in non-induced hTRPM7-HEK293-TREx cells was normalized to one using the data points acquired before compound application in each of the 96 wells. Data were averaged and plotted against time of the experiment. Wells were exposed to either 30 U, 20 U, or 10 U thrombin in the absence of extracellular Ca2+, or superfused with external solution without thrombin (control) (n = 3, each condition). c Same experimental setup as in b, however, cells had been induced with tetracycline for 20 h to overexpress hTRPM7 (n = 3, each concentration). d The graph plots the maximal change in the 340 nm/380 nm ratio induced by thrombin exposure. Data taken from b and c (*p < 0.05)

