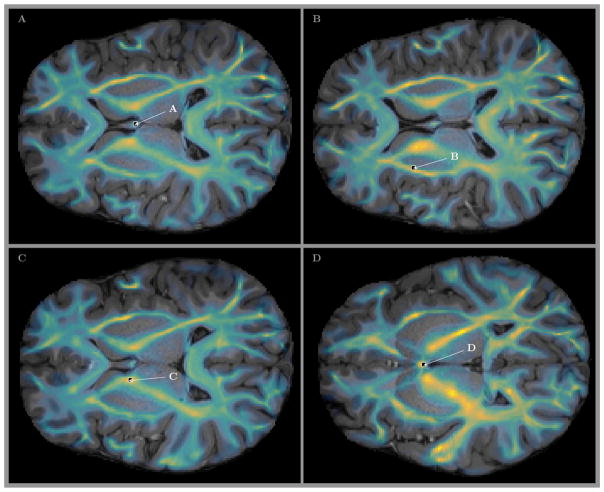
Figure 5.
Locations of the voxels shown in A, B, C, and D of Fig 4 (and in B, C, D, and F panels of Fig 3. The parula colored overlay shows the map of fiber counts across the slices. It can be clearly seen that the fibers used for our analysis are located in the areas of deep white matter and major tracts, which is the primary focus of Wedeen et al. (2012a).

