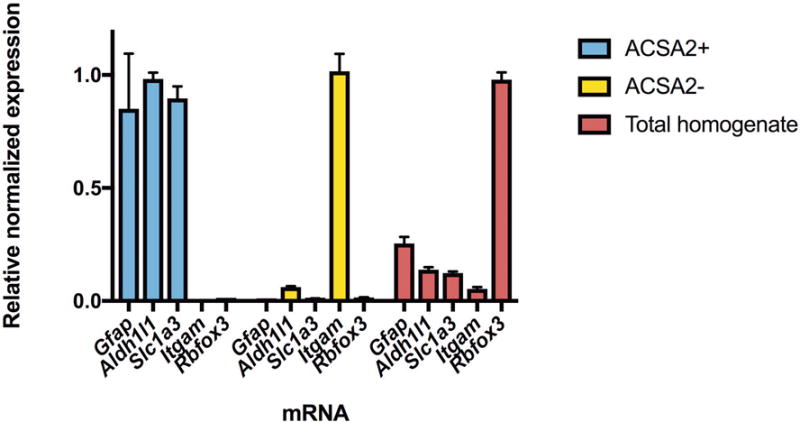
Figure 2.

Analysis of cell fractions following astrocyte enrichment. The ACSA2+ fraction was isolated using the ACSA2 microbeads, while the ACSA2- fraction represents unbound cells. The total homogenate was not fractionated and contains all cells. qRT-PCR for astrocyte markers including Slc1a3, Aldh1l1 and Gfap confirm that the ACSA2+ fraction was enriched with astrocytes compared to the ACSA2- and total homogenate fractions. Markers for neurons (Rbfox3) and microglia (Itgam) show little neuronal or microglial gene expression in ACSA2+ cells. Expression levels are relative to 18S rRNA and normalized to the sample with highest expression for each marker. Values are mean ± SEM, for n=3.
