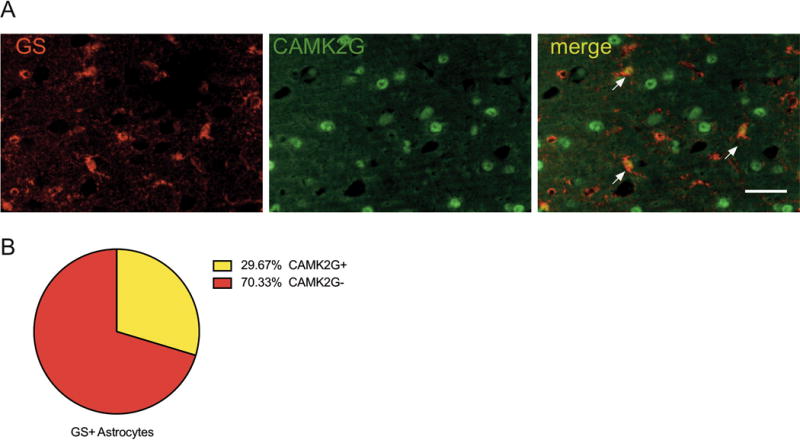
Figure 5.

CAMK2G expression in astrocytes. (A) Representative image shows co-localization of CAMK2G (green) and GS astrocytes (red). Arrowheads point to examples of co-localization. Scale bar corresponds to 50μm. (B) 30% of GS+ astrocytes expressed CAMK2G. Cell counts were averaged between regions of interest from two sections per animal (n = 3).
