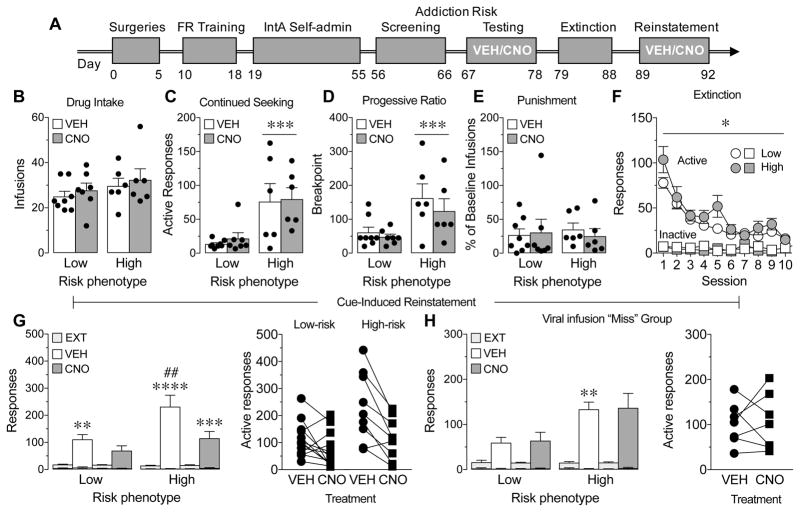
Figure 3.
Chemogenetic inhibition of direct pathway striatal neurons (dMSNs) reduces cue-induced reinstatement of drug-seeking only in the high-risk addiction phenotype. A, Illustration of the experimental paradigm. B–E, Low- and high-risk addiction phenotypes showed a significant difference in the number of active responses made during no drug periods (C, data averaged across 2 test sessions, ***main effect of phenotype, p=0.0004) and in the breakpoint reached on a PR schedule of reinforcement (D, main effect of phenotype, p=0.003) but not in the number of infusions earned averaged across 2 test session (B) or in the percent of baseline infusions earned when infusions were paired with foot shock (E). Decreasing dMSN activity had no effect on the number of earned infusions averaged across 2 test sessions (B), the number of active responses made during no drug periods averaged across 2 test sessions (C), the breakpoint reached on a PR schedule of reinforcement (D), or the percent of baseline infusions earned when infusions were paired with foot shock (E) in either low-risk or high-risk addiction phenotypes. F, Active (but not inactive) responses during extinction varied over session between low-risk and high-risk addiction phenotypes (*session x phenotype interaction, P=0.04), but both groups extinguished responding. G, Both low-risk and high-risk addiction phenotypes showed a significant increase in the number of active responses made during cue-induced reinstatement compared to extinction (**P=0.004, ****P<0.0001 vs. extinction); however, the high-risk addiction phenotype showed a greater level of cue-induced reinstatement compared to the low-risk phenotype (##P=0.004 vs. low-risk phenotype). Decreasing dMSN activity significantly reduced the number of active responses made during cue-induced reinstatement only in the high-risk addiction phenotype (***P=0.0004 vs. vehicle treatment in the high-risk phenotype). H, In the viral injection “miss” group, the high-risk addiction phenotype showed a significant increase in the number of active responses made during cue-induced reinstatement compared to the low-risk phenotype (**P=0.02 vs. low-risk phenotype). However, there were no differences in cue-induced reinstatement between vehicle and CNO treatment in either phenotype. Lower error bars indicate inactive presses, which did not differ across groups. White bars represent vehicle (VEH) treatment and dark grey bars represent CNO treatment except in F where white symbols represent the low-risk addiction phenotype and grey symbols represent the high-risk addiction phenotype. Circles represent active responses and squares represent inactive responses. Black circles and squares represent data points of individual animals. N=3–13/group.

