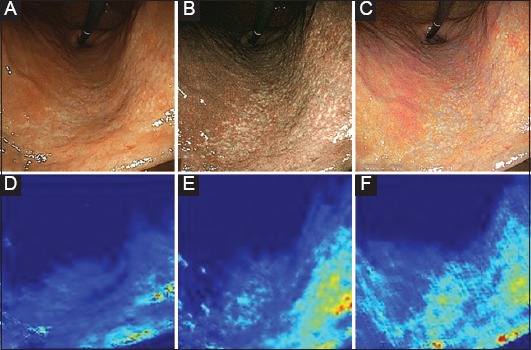
Figure 3.

Feature maps of the AI corresponding to the endoscopic images. Endoscopic images of a H. pylori-positive subject (test group). An image in WLI of EGD (A) shows yellowish mucosa in the lesser curvature (lower part of the picture). An image in BLI-bright (B) shows small whitish spots scattered over the mucosal surface (region between the central part and the lower right part of the picture). An image in LCI (C) shows a pale-white color change in the same area. Feature maps of convolutional layers during the AI test are also shown for WLI (D), BLI-bright (E) and LCI (F). In each IEE image, the AI responded to the lesser curvature of the stomach, which was the region of mucosal atrophy with intestinal metaplasia, indicated by a light green or a light blue color
AI, artificial intelligence; WLI, white light imaging; BLI, blue laser imaging; LCI, linked color imaging; H. pylori, Helicobacter pylori.
