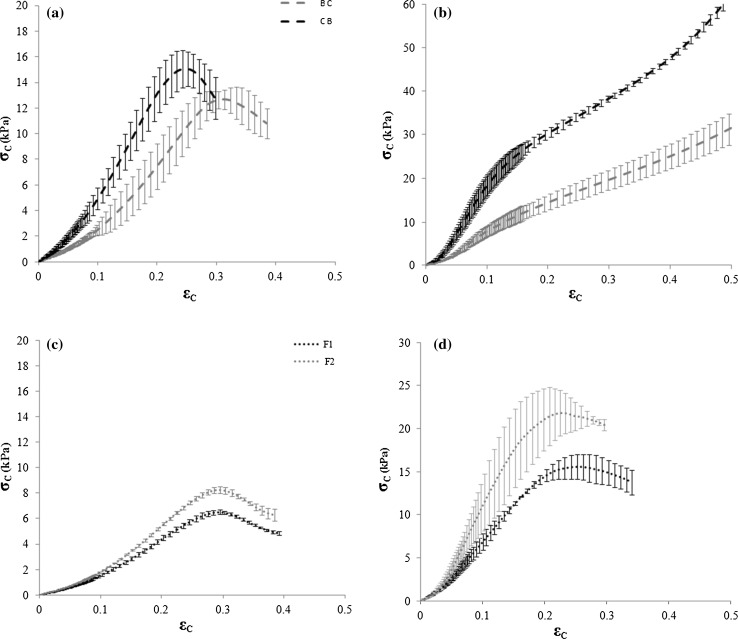
Fig. 3.
Stress (σc) versus strain (εc) curves of different dough formulations, both chilled (a–c) and frozen (b–d) stored. BC sample (80% water + 20% mixed flours, 70% of B and 30% of C); CB dough (80% water + 20% mixed flours, 30% of B and 70% of C); F1 (80% water + 15% mixed flours, 30% of B and 70% of C, + 5% other ingredients); F2 (80% water + 15% mixed flours,70% of B and 30% of C, + 5% other ingredients) (dough formulation: a, b BC and CB; c, d F1 and F2)

