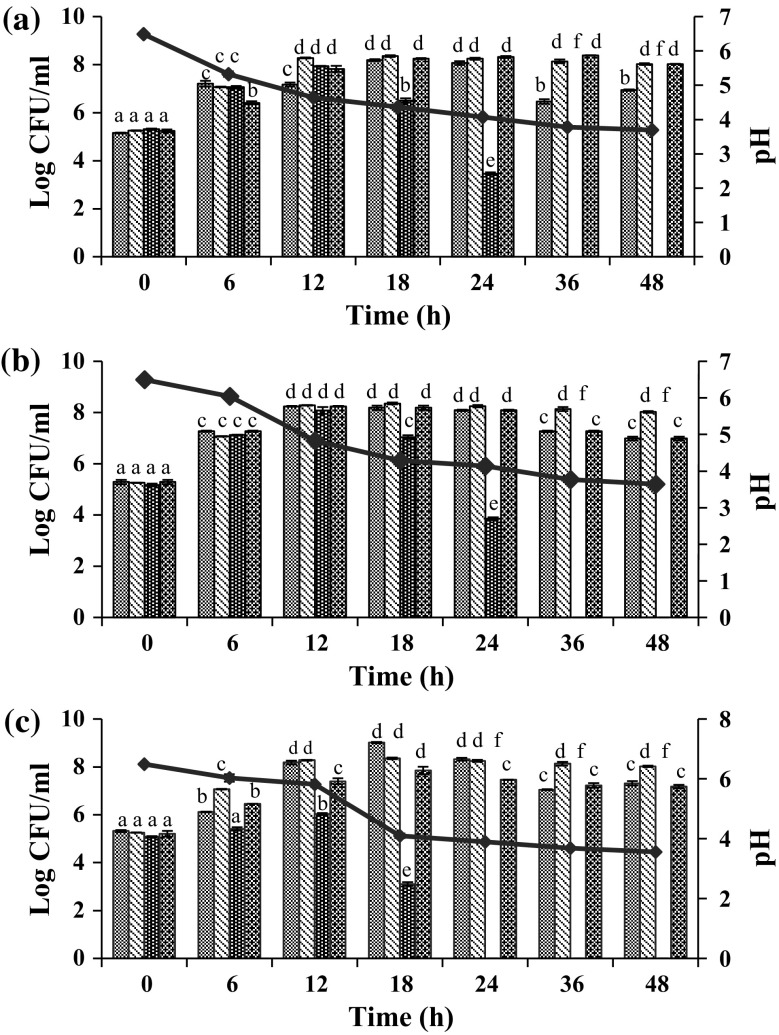
Fig. 3.
Growth of E. coli DMST 4212 (a), S. aureus DMST 8840 (b), and L. monocytogenes DMST 17303 (c) in co-culture system.
 Pathogen alone;
 SKI19 alone;
 Pathogen in co-culture;
 SKI19 in co-culture;
 pH in co-cultivation. The results (Mean ± S.D) of three experiments with lowercase letters (a–f) indicate a significant difference (P <0.05)

