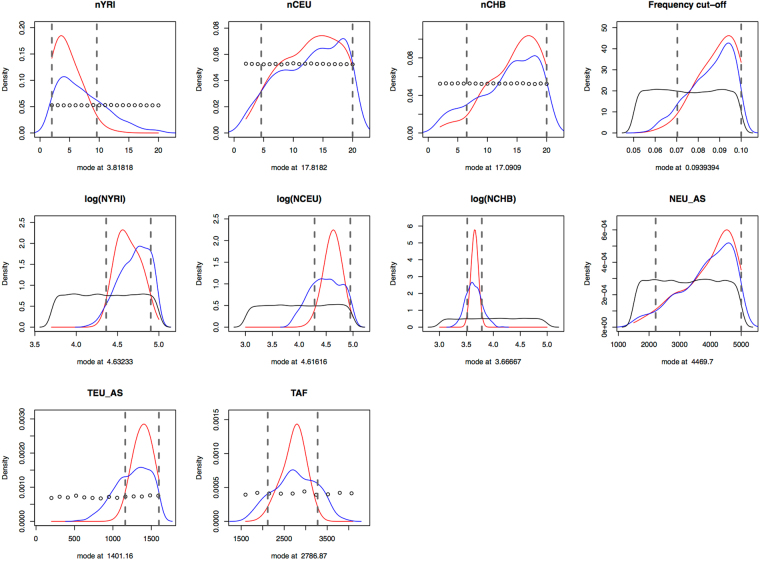
Figure 4.
Posterior distributions of the discovery set and demographic parameters as estimated from the Out-of-Africa model using the observed data. The black curve corresponds to the prior distribution of the parameter values, while the blue one is the truncated prior distribution. The truncated prior distribution is built based on the parameter values of the retained simulations that are kept for analysis based on euclidean distance of the simulated summary statistics from the observed summary statistics, thus making these values a subset of the prior distribution and directly affecting the amount of information given for inference. The red curve is the posterior distribution, and the dashed lines are the 95% High Posterior Density Interval. Results estimated with 8 PLS components and 500 retained simulations.

