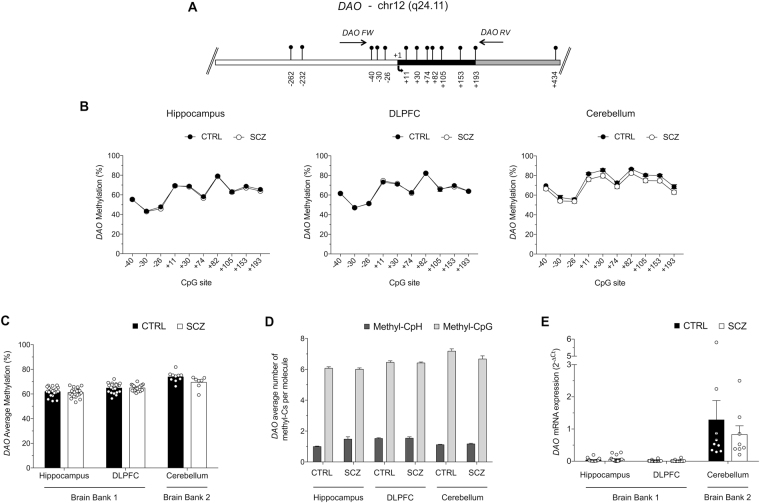
Figure 1.
Epigenetic analysis of DAO. (A) Structure of the DAO gene showing the putative regulatory upstream region (white box), exons (black box) and first intron (grey box). Transcriptional start site (+1) is indicated by an arrow. Vertical bars represent the relative position of each CpG site and the arrows indicate the primer positions. The gene sequence was retrieved by Ensemble database accession number: DAO ENSG00000110887. (B) The methylation average at each CpG site, between the two groups (CTRL: black circles; SCZ; open circles) for each region (HIPP, DLPFC and CB) is reported in the graphs. (C) The average methylation of controls (CTRL) and subjects with schizophrenia (SCZ) in hippocampus (HIPP), dorsolateral-prefrontal cortex (DLPFC) and cerebellum (CB) areas is reported in the histogram. (D) For each sample group and brain area, the number of mCpH and mCpG per molecule was calculated as described in the Materials and Methods section. The percent values of non-CpG methylation are reported in Table S2. (E) DAO mRNA expression levels in the HIPP, DLPFC and CB of control and schizophrenia patients were detected by quantitative RT-PCR and expressed as 2−ΔCt. All data are shown as the mean ± standard error (SEM).

