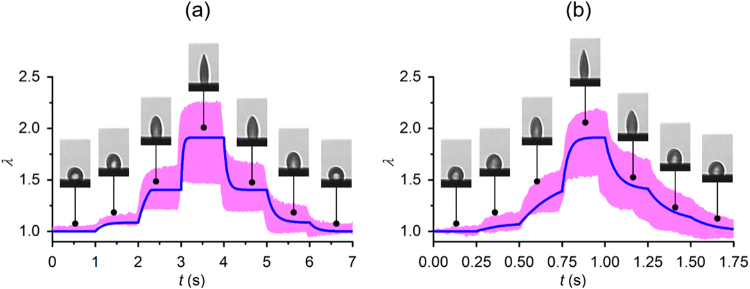
Figure 5.
Quantitative comparisons of the theoretical predictions and the experimental observations (n = 10) of cellular deformations in response to a stepwise electric excitation E2. (a) Duration of each step is 1 s. (b) Duration of each step is 0.25 s. Insets show cell deformations of a representative RBC measured at specific times. The blue lines represent the theoretical calculation. Pink band represent the cell deformation profiles from 10 measurements.

