Figure 6.
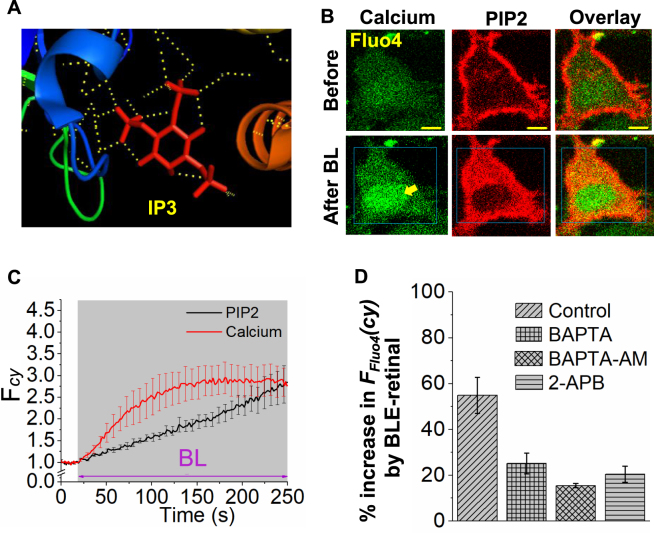
All trans retinal and blue light induced signaling in cells. (A) Crystal structure of the IP3 receptor bound with IP3 with H-bonding interactions (PDB code:1N4K), suggesting the PIP2 can have the majority of interactions exhibited by IP3. (B) HeLa cells expressing PIP2 sensor (mCherry-PH) and incubated with calcium sensor Fluo4. Fluo4 stained cells were incubated with ATR (50 µM) for 5 minutes, followed by exposure of blue light (4.86 µW of 445 nm) for 3 minutes. Here the whole cell was exposed to blue light. A substantial increase in cytosolic calcium is observed. (C) Dynamics of calcium responses and PIP2 translocation in the cells shown in B (mean ± S.E.M., n = 5 cells). (D) Calcium responses in control and calcium modulator-incubated (using BAPTA-AM and 2-APB) HeLa cells in regular and extracellular calcium free (using BAPTA) buffers. Here, cells were pre-incubated Fluo4 were incubated with 2-APB (5 µM for 15 min), BAPTA-AM (10 µM for 30 min), or BAPTA (5 µM for 5 min) in calcium free HBSS buffer. The cells were then incubated with ATR (50 µM) for 5 minutes, followed by continuous exposure of blue light for 5 minutes. The bar chart shows the changes in calcium sensor fluorescence in the cytosol before and after blue light exposure on cells for all the above mentioned experiments (mean ± S.E.M., n = 5–15 cells). Mean and S.E.M. are from 3 < independent experiments. (blue light (BL) = blue box). Scale = 5 µm.

