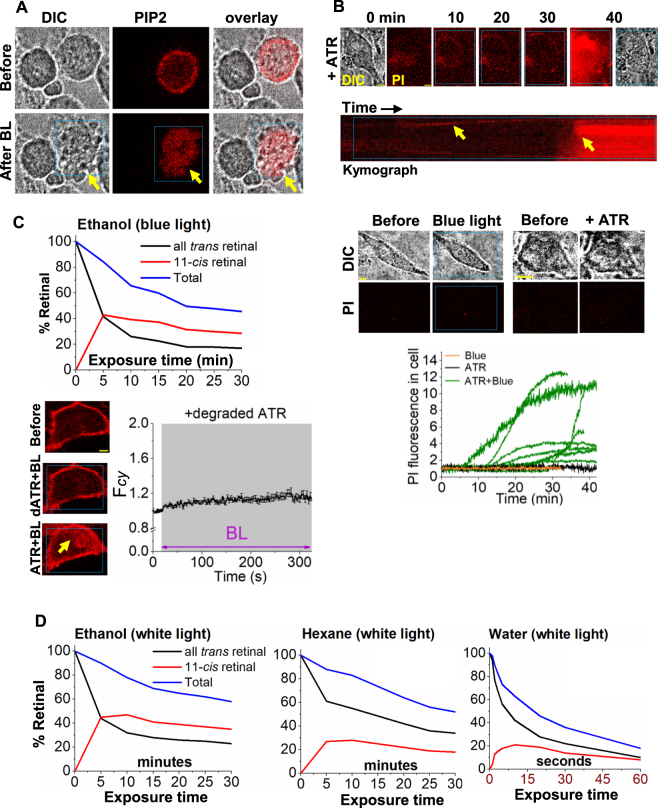
Figure 7.
Photoexcited retinal induced cytotoxicity. (A) Fluorescence and DIC images of HeLa cells treated with ATR (50 µM) followed by blue light exposure (4.86 µW of 445 nm). Only the middle cell (yellow arrow) expresses PIP2 sensor. Blue light exposed (blue box) cell showed substantial change in cell shape and morphology. The PIP2 sensor also accumulates in cytosol upon blue light exposure. (B) HeLa cells were incubated with propidium iodide (PI) with ATR (50 µM) and exposed to blue light (4.86 µW) for 45 minutes. Incorporation of PI in to cells were observed upon light exposure. The control experiments performed with cells exposed to only to blue light or only to ATR, did not show PI incorporation into cells over time. Plot shows the different rates of PI incorporation into cells compared to control experiments. (C,D) Solvent dependent degradation and isomerization of ATR. (C) ATR (20 µL of 50 mM in ethanol) was exposed to blue LED light for 30 minutes. The blue light exposed ATR (injection sample: 1 µL of exposed ATR was diluted in 1 mL of ethanol) was analyzed by HPLC where degradation of ATR is observed by reduction of corresponding ATR peak in chromatogram. right: The degraded ATR (dATR) (1 µL) was added to HeLa cells (final volume of imaging buffer = 1 mL) expressing PIP2 sensor and continuously exposed to 445 nm light (4.86 µW). Cells did not show detectable PIP2 translocation upon blue light. Exposure of cells to fresh ATR (50 µM) and blue light (BL) induced PIP2 distortion (mean ± S.E.M., n = 12). (D) HPLC analysis of retinal in different solvents after exposing to white light for varying durations. Note that retinal in water degrades in seconds while in ethanol and hexane show over 100 times enhanced stability. Improved isomerizations were seen as well. Mean and S.E.M. are from 3 < independent experiments. (blue light (BL) = blue box). Scale = 5 µm.

