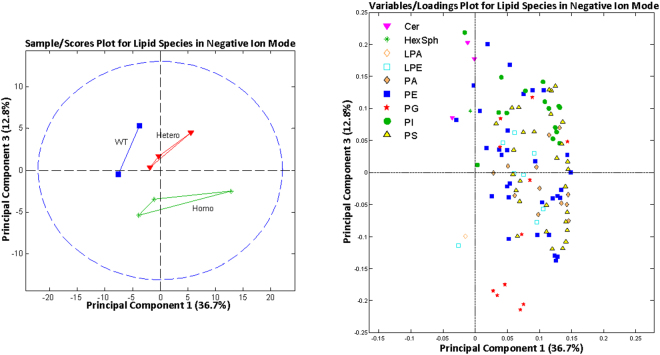
Figure 5.
Principal component analysis of lipid species identified by mass spectroscopy in positive ion mode. Outliers from the origin of the loadings plot heavily influence the separation of groups on the scores plot. WT, wild-type; Hetero, heterozygous; Homo, homozygous; CER, ceramide; HexSph, hexosylsphingosine; LPA, lysophosphatidic acid; LPE, lysoglycerolphosphoethanolamine; PA, glycerophosphatidic acids; PE, phosphatidylethanolamine; PG, glycerophosphoglycerol; PI, glycophosphoinositols; PS, glycerophosphoserines.

