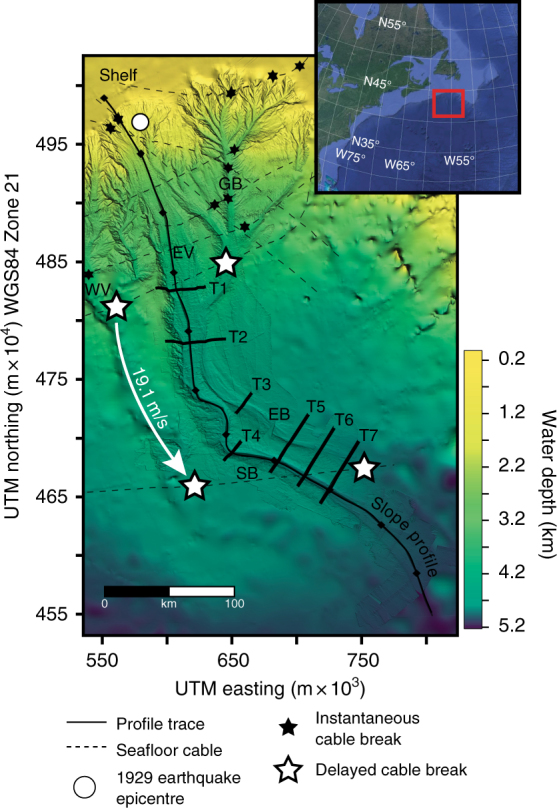
Fig. 1.

Bathymetry of the Grand Banks slope shown via a General Bathymetric Chart of the Oceans (GEBCO) base map, which is overlain by higher-resolution swath bathymetry collected aboard Cruise MSM47 in 2015. Several major channel systems were pathways for the 1929 flow: Western Valley (WV), Grand Banks Valley (GB), and Eastern Valley (EV), which splits into two smaller channels: East Branch (EB) and South Branch (SB). Delayed cable breaks provide a direct measure of flow speed (19.1 ms−1). A down slope profile (Fig. 4) runs through the Eastern Valley channel system with 7 channel cross-section profiles (T1-T7) (Fig. 3). Insert map uses satellite imagery from Google Earth ProTM
