Fig. 1.
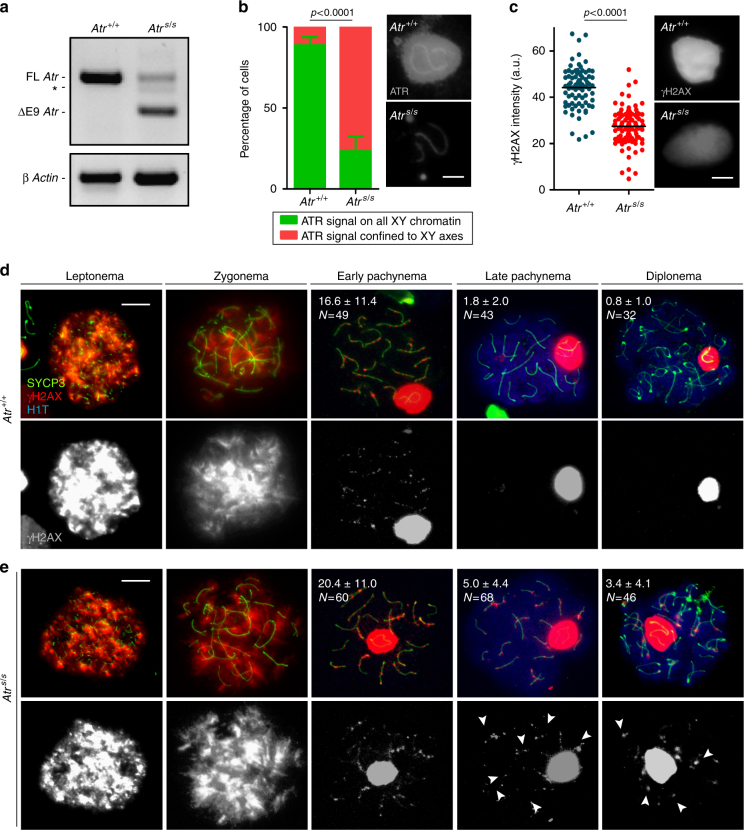
Seckel mouse spermatocytes exhibit more γH2AX patches than wild-type cells. a RT-PCR using primers that anneal to Atr exons 8 and 10. AtrS/S testis exhibits two main RT-PCR products, one corresponding to full-length Atr (FL Atr, 477 bp), which is substantially reduced, and another corresponding to Atr lacking exon 9 (ΔE9 Atr, 284 bp). Asterisk denotes RT-PCR product resulting from the use of a cryptic splice donor site16. RT-PCR for β Actin is also provided as a control. b Percentage of cells exhibiting ATR staining extended to X and Y chromatin or confined to the X and Y chromosome axes in Atr+/+ and AtrS/S (N = 284 and N = 282, respectively). Columns and lines indicate the mean and standard deviation (SD) from analysis performed on three wild-type and three mutant mice. Images show ATR straining on the sex body in Atr+/+ and AtrS/S pachytene spermatocytes. Images were captured with the same exposure time. Scale bar = 2 μm. c Quantification of the intensity of γH2AX staining on the sex body in arbitrary units (a.u.). Horizontal black lines denote the means. Images show representative sex bodies from Atr+/+ and AtrS/S pachytene spermatocytes immunostained against γH2AX. Images were captured with the same exposure time. Scale bar = 2 μm. Representative images of Atr+/+ (d) and AtrS/S (e) spermatocytes at different stages of meiotic prophase immunostained against SYCP3, γH2AX, and H1T. Scale bars = 10 μm. Numbers represent the mean ± SD of γH2AX patches found in each stage and genotype. N denotes the number of cells analyzed. H1T incorporation marks spermatocytes after mid-pachynema62. Arrowheads indicate examples of aberrant autosomal γH2AX patches in AtrS/S spermatocytes. The differences between controls and AtrS/S for γH2AX patch numbers at late pachynema and diplonema were statistically significant (p = 0.0001 and p = 0.0007, respectively, t test)

