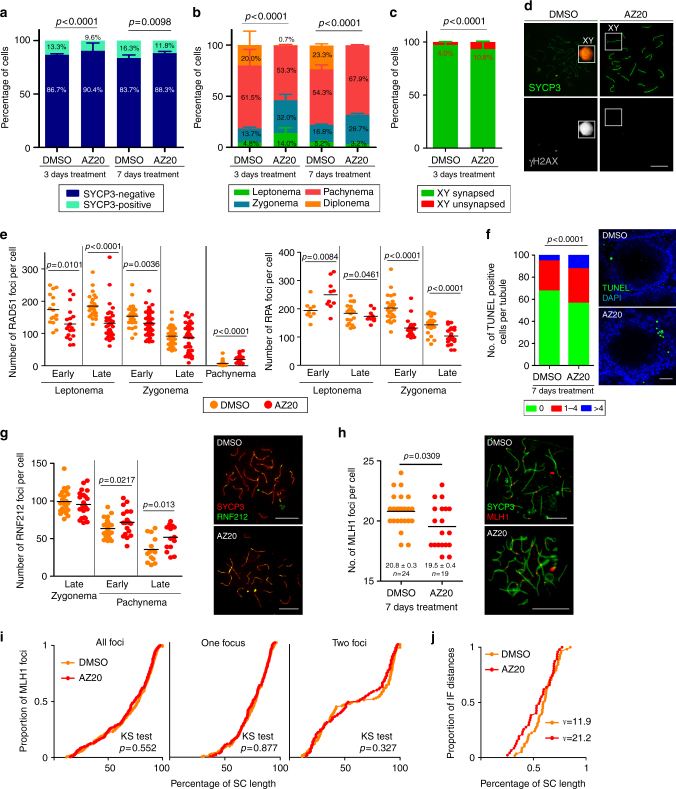
Fig. 4.
In vivo inhibition of ATR affects prophase progression and recombination markers. a Percentage of SYCP3-positive cells from mouse testes treated 3 or 7 days with DMSO (N = 2057 and N = 986 cells, respectively) or AZ20 (N = 2063 and 936 cells, respectively). Two mice per condition were analyzed. P value is from Fisher’s exact test. b Percentage of spermatocytes at different prophase stages in 3 and 7 days DMSO- (N = 2035 and N = 600) and AZ20-treated mice (N = 2091 and N = 600 cells, respectively). Two mice per condition were analyzed. P value is from G test. c Percentage of pachytene cells exhibiting unsynapsed X and Y chromosomes in DMSO- (N = 472) and AZ20-treated spermatocytes (N = 426). Two mice per condition were analyzed. P value is from Fisher’s exact test. d Representative images of DMSO- and AZ20-treated pachytene spermatocytes stained for SYCP3 and γH2AX. Note the presence of a sex body over the X and Y chromosomes in the control, but not in the AZ20-treated cell. e RAD51 and RPA foci per spermatocyte at the indicated stages in DMSO- and AZ20-treated mice. Horizontal lines denote the means. P values are from t tests. f Proportion of tubule sections with 0, 1–4, or >4 TUNEL-positive cells from mice treated with DMSO or AZ20. P value is from t test. Scale bar = 40 µm. g RNF212 foci in pachytene spermatocytes after 7 days of DMSO or AZ20 treatment. Horizontal black lines denote the means. P value is from t test. Images show pachytene spermatocytes immunostained for SYCP3 and RNF212. Scale bars = 10 μm. h Autosomal MLH1 foci in pachytene spermatocytes after 7 days of DMSO or AZ20 treatment. Horizontal black lines denote the means. P value is from a Mann–Whitney test. Images show pachytene spermatocytes immunostained for SYCP3 and MLH1. Scale bars = 10 μm. i Cumulative frequency plots comparing MLH1 focus distribution along autosomal bivalents from pachytene spermatocytes after 7 days of DMSO or AZ20 treatment. MLH1 focus distribution along all autosomal bivalents was similar between DMSO (N = 320) and AZ20 (N = 233) treatments. In SCs presenting one MLH1 focus from DMSO- (N = 204) and AZ20- (N = 138) treated mice or two MLH1 foci from DMSO- (N = 116) and AZ20- (N = 94) treated mice, MLH1 focus location was also indistinguishable (KS test). j MLH1 interfocal distances expressed as a percentage of SC length from autosomal bivalents containing two MLH1 foci. Shape parameters (ν) from gamma distribution are shown34

